Algebra 1 Mini-Lessons
Algebra 1 Mini-Lessons. The table below shows how old Marsha and Tony were in several different years. If T represents Tony's age and M represents Marsha's age, which equation could be used to correctly predict Tony's age when Marsha is 20 years old?. T = 20 − M T = M + 4 T + M = 4

Algebra 1 Mini-Lessons
E N D
Presentation Transcript
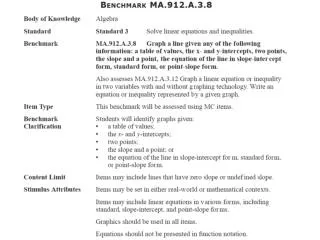
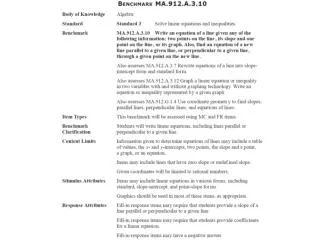
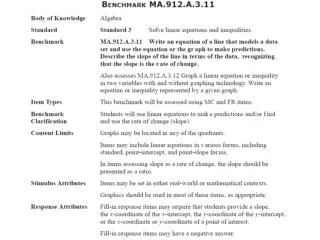
Algebra 1 Mini-Lessons The table below shows how old Marsha and Tony were in several different years. If T represents Tony's age and M represents Marsha's age, which equation could be used to correctly predict Tony's age when Marsha is 20 years old? • T = 20 − M • T = M + 4 • T + M = 4 • T + 16 = 20M MA.912.A.3.11: Write an equation of a line that models a data set and use the equation or the graph to make predictions. Describe the slope of the line in terms of the data, recognizing that the slope is the rate of change.
Algebra 1 Mini-Lessons A bungee jumper tried many jumps off of a bridge with different lengths of bungee cord. The distance he fell before the cord pulled tight is shown in the graph below. When the points on the graph are connected to form a straight line, what does the slope of this line represent? • The slope is , which means that for every 1 foot of cord, he will fall 5 feet. • The slope is , which means that for every 5 feet of cord, he will fall 1 foot. • The slope is , or 5, which means that for every 1 foot of cord, he will fall 5 feet. • The slope is , or 5, which means that for every 5 feet of cord, he will fall 1 foot. MA.912.A.3.11: Write an equation of a line that models a data set and use the equation or the graph to make predictions. Describe the slope of the line in terms of the data, recognizing that the slope is the rate of change.
Algebra 1 Mini-Lessons The table shows the number of hours Tim and Stephen have practiced their piano lessons at the end of each week. Let T represent the number of hours Tim practices and let S represent the number of hours Stephen practices.If they both continue to practice at the same rate, which equation could be used to correctly predict the number of hours Stephen will have practiced his piano lessons when Tim has practiced for 11 hours? • S = 29 • S = 3T + 2 • S = 2T + 9 • S = 2T + 11 MA.912.A.3.11: Write an equation of a line that models a data set and use the equation or the graph to make predictions. Describe the slope of the line in terms of the data, recognizing that the slope is the rate of change.
Algebra 1 Mini-Lessons The total cost of a taxi for certain distances is shown in the table below.The relationship between the values in the table can be expressed as a linear function. What is the slope of this function? m = 2 MA.912.A.3.11: Write an equation of a line that models a data set and use the equation or the graph to make predictions. Describe the slope of the line in terms of the data, recognizing that the slope is the rate of change.
Algebra 1 Mini-Lessons The table below shows how old Andrew and Lorne were in several different years.If A represents Andrew's age and L represents Lorne's age, which equation could be used to correctly predict Andrew's age when Lorne is 30 years old? • A = L − 7 • A = 30 − L • A + 21 = 30L • A = L − 9 MA.912.A.3.11: Write an equation of a line that models a data set and use the equation or the graph to make predictions. Describe the slope of the line in terms of the data, recognizing that the slope is the rate of change.
Algebra 1 Mini-Lessons The table below shows the distance, in inches, that a snail and a centipede have traveled over several minutes. Let S represent the number of inches the snail has traveled and let C represent the number of inches the centipede has traveled. If they both continue at the same rate, which equation could be used to correctly predict the distance the centipede will have traveled when the snail has traveled 12 inches? • C = 43 • C = 2S + 16 • C = 3S + 11 • C = 4S + 3 MA.912.A.3.11: Write an equation of a line that models a data set and use the equation or the graph to make predictions. Describe the slope of the line in terms of the data, recognizing that the slope is the rate of change.
Algebra 1 Mini-Lessons David is training for a marathon. He writes down the time and distance for each training run and then records the data on a scatter plot. He has drawn a line of best fit on the scatter plot, as shown below. Which statement best expresses the meaning of the slope as a rate of change for this line of best fit? • It represents the number of miles he will have to run to finish the marathon. • It represents the average speed, in miles per hour, of his training runs. • It represents the number of hours he will need to finish the marathon. • It represents the distances, in miles, that he ran while he was training. MA.912.A.3.11: Write an equation of a line that models a data set and use the equation or the graph to make predictions. Describe the slope of the line in terms of the data, recognizing that the slope is the rate of change.
Algebra 1 Mini-Lessons What is the x-coordinate of the point at which this line intersects the x-axis? MA.912.A.3.11: Write an equation of a line that models a data set and use the equation or the graph to make predictions. Describe the slope of the line in terms of the data, recognizing that the slope is the rate of change.