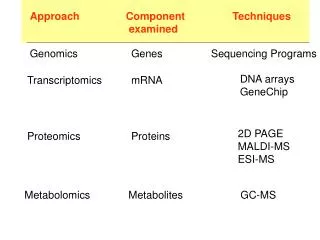
Approaches for Differential Gene Expression Detection in Microarray Analysis
Learn about clustering vs. differential expression, fold change, t-test, FDR, SAM, Mann-Whitney, and examples. Explore techniques like SAM and multiple testing.

Approaches for Differential Gene Expression Detection in Microarray Analysis
E N D
Presentation Transcript
Comp. Genomics Recitation 10 4/7/09 Differential expression detection
Outline • Clustering vs. Differential expression • Fold change • T-test • Multiple testing • FDR/SAM • Mann-Whitney • Examples
Microarray preliminaries • General input: A matrix of probes (sequences) and intensities • We assume the hard work is over: • Probes are assigned to genes • The data is properly (?) normalized • We have an expression matrix • Rows correspond to genes • Columns correpond to conditions
Microarray analysis • Common scenarios: • We tested the behavior of genes across several time points • We test a large number of different condtions • Clustering is the solution • We compared a small number of conditions (2) and have multiplereplicates for each condition • E.g., we took blood expression in 10 sick and 10 individuals • Differential expression analysis
Identification of differential genes • The most basic experimental design: comparison between 2 conditions – ‘treatment’ vs. control • More complex: sick/treatment/control • The goal: identify genes that are differentially expressed in the examined conditions • Number of replicates is usually low (n=2-4) • Statistics are important Slides: Rani Elkon
Approaches for identification of differential genes • Fold Change • T-test • SAM
1. Fold Change • Consider genes whose mean expression level was change by at least 1.75-2 fold as differential genes • Pros: • Very simple! • Cons: • Usually no estimation of false positive rate is provided • Biased to genes with low expression level • Ignores the variability of gene levels over replicates.
Fold Change limit – Biased to low expression levels Determine ‘floor’ cut-off and set all expression levels below it to this floor level
Fold Change limit – ignores variability over replicates • We need a score that ‘punishes’ genes with high variability over replicates
Approaches for identification of differential genes • Fold Change • T-test • SAM
2. T-test • Compute a t-score for each gene mc, mt – mean levels in Control and Treatment Sc2, St2 – variance estimates in Control and Treatment nc, nt – number of replicates in in Control and Treatment
T-test • The t-score is good because it is a results of a well known statistical hypothesis testing • If we assume the sample is normally distributed (unknown variance) and compare two hypotheses: • H0 – All the measurements come from the same distribution • H1 – All the measurements come from different normal distributions • In this case a p-value can be derived for every t-score
T-test • Set cut-off for p-value (α=0.01) and consider all genes with p-value < α as differential genes
Multiple Testing • Pg associated with the t-score tg is the probability for obtaining by random a t-score that is at least as extreme as tg. • Multiplicity problem: thousands of genes are tested simultaneously (all the genes on the array!) • Simple example: • 10,000 genes on a chip • not a single one is differentially expressed (everything is random) • α=0.01 • 10000x0.01 = 100 genes are expected to have a p-value < 0.01 just by chance.
Multiple testing • Individual p–values of e.g. 0.01 no longer correspond to significant findings. • Need to adjust for multiple testingwhen assessing the statistical significance of findings • Actually this is a somewhat common problem in statistics
Multiple Testing • Simple solution (Bonferroni): consider as differential genes only those with p-value < (α/N) • N: number of tests • α=0.01, N=10,000: cut-off=0.000001 • Ensure very low probability for having any false positive genes (less than α) • Advantage: very clean list of differential genes • Limit: the list usually contains very few genes… unacceptable high rate of false negatives
FDR correction (Benjamini & Hochberg) • False Discovery Rate • In high-throughput studies certain proportion of false positives is tolerable • Control the expected proportion of false positives among the genes declared as differential (q=10%). • Scheme: • Rank genes according to their p-vals: p(1)<p(2)…<p(N) • Consider as differential the top k genes, where k = max{i: p(i)< i*(q/N)}
Approaches for identification of differential genes • Fold Change • T-test • SAM
3. SAM (Tusher, Tibshirani & Chu) • ‘Significance Analysis of Microarray’ • Limit of analytical FDR approach: assumes that the tests are independent • In the microarray context, the expression levels of some genes are highly correlated → unreliable FDR estimate • SAM uses permutations to get an ‘empirical’ estimate for the FDR of the reported differential genes
SAM • Scheme: • Compute for each gene a statistic that measures its relative expression difference in control vs ‘treatment’ (t-score or a variant) • Rank the genes according to their ‘difference score’ • Set a cut off (d0) and consider all genes above it as differential (Nd) • Permute the condition labels, and count how many genes got score above d0(Np) • Repeat on many (all possible) permutations and count (Npj) • estimate FDR as the proportion: Average(Npj)/Nd
d1p1 d1p2 d2p1 d2p2 d3p1 d3p2 Permutation on condition labels BACK
SAM example • Ionizing radiation response experiment • After setting the threshold: • 46 genes found significant • 36 permutations • 8.4 genes on average pass the threshold • False discovery rate is 18%
Mann-Whitney/Wilcoxon • In general normality assumption of t-test is problematic • Aparametric statistics are very useful in many bioinfo related problem • Assume nothing about the distribution of the samples • Less powerful (more false negatives, but less false positives)
Mann-Whitney/Wilcoxon • MW/Wilcoxon test for two samples: • H0 – The medians of both distributions are the same • H1 – The medians of the distributions are different • Assumes: • The two samples are independent • The observations can ordered (ordinal)
Mann-Whitney/Wilcoxon • Computes a U-score whose distribution is known under H0 (& can be approximated by normal distribution in large samples) • Arrange all the observations into a single ranked series • Add up the ranks in sample 1. The sum of ranks in sample 2 follows by calculation, since the sum of all the ranks equals N(N+1)/2 • U-score: