Systemic Safety Project Selection Process: Prioritizing Locations for Safety Improvements
The Systemic Safety Project Selection Process aims to develop a prioritized list of locations that could benefit from systemic safety countermeasures. This involves conducting a thorough risk assessment of specific sites, including intersections, curves, and segments. The process encompasses screening potential locations, assessing their risks using traffic and geometric data, and identifying top candidates for safety improvements. By evaluating contributing factors and crash histories, the process ensures targeted interventions to enhance roadway safety effectively.

Systemic Safety Project Selection Process: Prioritizing Locations for Safety Improvements
E N D
Presentation Transcript
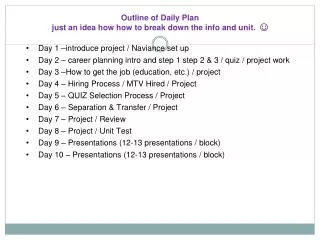
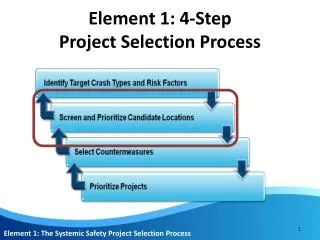
Element 1: 4-Step Project Selection Process Element 1: The Systemic Safety Project Selection Process
Objective • Develop a prioritized list of locations that could benefit from systemic safety countermeasures • Prioritized = Risk assessment for future crash; answers to question if all elements are equally at risk. • Location = Specific sites from focus facility type; including segments, curves, intersections, etc. Element 1, Step 2: Screen and Prioritize Candidate Locations
Outcome • An assessment and rating of the focus facility type(s). • Identify locations considered for systemic safety improvements. Element 1, Step 2: Screen and Prioritize Candidate Locations
Data Needs • Location of focus facility type • Signalized intersections • Horizontal curves • Divided corridors • Etc. • Site specific crash information • Severity, • Crash type • Relevant contributing factors • Traffic and geometric information • At minimum, for risk factors • Additional information may be needed for selecting countermeasure Element 1, Step 2: Screen and Prioritize Candidate Locations
Element 1: Step 2 Element 1, Step 2: Screen and Prioritize Candidate Locations
Element 1: Step 2, Task 1Identify Network Elements Analyzed Purpose: • Identify the all locations from the focus facilities • A census, not a sample Resources: • Road and intersection data • Crash data at statewide and regional levels Element 1: Step 2, Task 1
Element 1: Step 2, Task 1Identify Network Elements Analyzed Process: • Identify ALL locations from focus facility type. • Curves & Intersections: identify eligible locations • Segments: • Split corridors into elements with consistent traffic and design characteristics (i.e., cross section) • Identify logical segment endpoints 2.Are risk factors feasible for a systemwide analysis? • Did you notice anything that suggests a need to change risk factors? Element 1: Step 2, Task 1
Element 1: Step 2, Task 2Conduct Risk Assessment Purpose: • Document the conditions (i.e., risk factors) at each location selected for analysis. Suggestion • While collecting information about risk factors, consider what data might be needed to assign/select the countermeasure. Element 1: Step 2, Task 2
Element 1: Step 2, Task 2Conduct Risk Assessment Resources: • GIS • Electronic inventories of roadway features and traffic characteristics • Data collected as part of a field review • Archives of as-built plans • Aerial photography/street views • Video logs • Traffic control device inventories • Traffic flow maps Element 1: Step 2, Task 2
Element 1: Step 2, Task 2Conduct Risk Assessment Process: • Record roadway and traffic characteristics for the selected risk factors • Document crash history (particularly severe focus crashes) for each location. Element 1: Step 2, Task 2
Video Logs 1 – Usable Shoulder, Reasonable Clear Zone • Edge Risk Assessment • See photos • Lane Width • Shoulder Width/Type • Posted Speed Limit • Curve Signing • Sample Percent No Passing 2– Usable Shoulder, Roadside with Fixed Objects 3– No Usable Shoulder, Roadside with Fixed Obstacles 13
Aerial Images for Segments • Segment Access Points • Curve – Visual Trap and Intersection
Aerial Images for Intersections • Skew • Intersection on/near horizontal curve • Railroad crossing • Commercial Development in quadrants
Element 1: Step 2, Task 3Prioritize Roadway Facilities Purpose: • Use risk factors to assess locations’ risk. • Identify top sites considered for countermeasure implementation. Element 1: Step 2, Task 3
Element 1: Step 2, Task 3 Prioritize Roadway Facilities Process: • Prioritize roadway facilities using one of two methods to weight risk factors: • Equal weight to risk factors • Identify the risk factors present for each location • Sum the total number of risk factors for each location • Prioritize locations based on number of risk factors present • Weighted risk factors • Assign relative weights to each risk factor • Calculate a score for each location • Prioritize locations based on total score • Set a threshold (the number of risk factors present or a weighted value) used to identify high-priority candidates. • Flag the locations above the threshold. Element 1: Step 2, Task 3
Example County Segment Prioritization Is the County’s entire system at-risk? • No, about 25% of their miles were determined to be a High Priority Element 1: Step 2, Task 1
Example County Curve Prioritization • Complete census of 504 curves • 32 High Priority Curves (6%) • 138 Curves in Proximity Element 1: Step 2, Task 1
Example County Intersection Prioritization Is the County’s entire system equally at-risk? • No, about 41% of their system is a High Priority Element 1: Step 2, Task 1