Download

1 / 45
450 likes | 564 Vues
Data Sources and Support for Data Use Available through The Indiana Prevention Resource Center Report to the IPHA Advisory Board Advisory Board Meeting February 18, 2011. Goal of Accreditation.

E N D
Data Sources and Support for Data Use Available through The Indiana Prevention Resource Center Report to the IPHA Advisory Board Advisory Board Meeting February 18, 2011
Goal of Accreditation • “To improve and protect the health of the public by advancing the quality and performance of all health departments.” (p. 1) Source: Public Health Accreditation: Is Oregon Ready? http://www.oregon.gov/DHS/ph/lhd/docs/Oregon_accreditation.pdf?ga=tAccessed 2/13/2011; PHAB, Draft National Accreditation Standards, 2009, cited in preceding source, p. 1
Ways PHDs Can Fulfill Obligatory Functions • Internal capacity – do all the functions alone • Ask for specific assistance from the State • Coordinate w/ other agencies or near-by LHDs • Subcontract or control other agencies work Source: NACCHO, Operational Definition of a Functional Public Health Department [brochure], Nov. 2005, p. 4.
How IPRC Can Help • Community level data and maps • Comparisons to relevant geographic areas • Help LHDs staff increase skills for • Accessing data • How to use data • TA/consultation for grant-seeking; data use
Total Crime Index Indiana, 93 Source: Nielsen, 2009 Updates, 2010 Indiana Prevention Resource Center
Total Crime Index Indiana, 93; Monroe Co., 66
: 181050001001
: 181050001003
Duties of LHDsNeeding Data Support • Monitor Health Status and Understand Issues • Protect People from Health Problems/Hazards • Provide Information Healthy Choices • Engage Community to Identify/Solve Problems • Develop Public Health Policies and Plans Source: NACCHO, Operational Definition of a Functional Public Health Department [brochure], Nov. 2005, p. 7,
More Duties of LHDsNeeding Data Support • Enforce Public Health Laws and Regulations • Help People Receive Health Services • Maintain Competent Public Health Workforce • Evaluate and Improve Programs/Interventions • Contribute to & Apply the Evidence Base of Public Health Source: NACCHO, Operational Definition of a Functional Public Health Department [brochure], Nov. 2005, p. 6-8,
Duty #1 Monitor Health Status – Understand Issues Facing the Community • Community-Specific Data • Number of Uninsured • Indicators of Health Disparities, like: • High levels of poverty • Lack of affordable housing • Limited or no access to transportation Source: NACCHO, Operational Definition of a Functional Public Health Department [brochure], Nov. 2005, p. 6.
Duty #1 Monitor Health Status – Understand Issues Facing the Community • Integrate data with health assessment and data collection efforts conducted by others in the PH system • Analyze data to find trends, health problems, environmental health hazards, and conditions that adversely affect the public health. Source: NACCHO, Operational Definition of a Functional Public Health Department [brochure], Nov. 2005, p. 6.
Inevitably…. • There will be obstacles along the way. http://entertainment.webshots.com/photo/1040516534015901341MFYhbt
Obstacles • Cost, PH notoriously underfunded • Time, may take decades to see outcomes • Lack of agreed-upon PH outcomes Source: Brenda Joly, et al. “Linking Accreditation and Public Health Outcomes: A Logic Model Approach,” Journal of Public Health Management and Practice 29 (July/Aug 2007):349-356.
Data-specific Obstacles • Difficult to apply statewide data to locality • Inconsistent data release times Source: Public Health Accreditation: Is Oregon Ready? Analysis by Shannon Dames RN, MPH. From Accreditation Self-Assessment Tool – Oregon 01/2010.
Desirable and Reachable Outcomes • Increased capacity to define needs, plan for and carry-out services • Improved informational systems to gather, report, and utilize data • Increased confidence as a team and appreciation of our value and role • Better prepared to respond to situations or disaster that may occur. Source: Mary Davis, “NC Local Health Department Accreditation:What it Does and Doesn’t Do,” Oct. 2010. http://nciph.sph.unc.edu/accred/health_depts/WhatHappensAfterAccreditation.pdf Accessed 2-13-2011.
Mental, Emotional and Behavioral Disorders • Health of Individual • Mortality • Health-related quality of life • Health of Others • Family • Victims of Crime • Peers Economic Resources Informal Care Juvenile Justice Services Productivity Education Health Care Child Welfare Source: National Academy of Sciences, Preventing Mental, Emotional, and Behavioral Disorders Among Young People: Progress and Possibilities (2009). www.nap.edu/catalog/12480.html
IPRC Data Sources • County Profiles (data tables/maps for 92 Cos.) • Youth Risk Factor Data from IN Youth Survey • IN College Alcohol Survey • Health Condition Indicators • Assessment Tools, including Data Sources Source: See www.drugs.indiana.edu
IPRC Data Sources Source: www.drugs.indiana.edu/spf/page.php?category=Assessment Source: See www.drugs.indiana.edu
IPRC Data Sources Source: See www.drugs.indiana.edu
IPRC Data Sources Source: See www.drugs.indiana.edu
IPRC Data Sources Source: See www.drugs.indiana.edu
IPRC Data Sources Source: See www.drugs.indiana.edu
Indiana Youth Survey Source: http://www.drugs.indiana.edu/data-survey_monograph.html
Custom Report Variables Source: www.latino.prev.info Source
Statistical Reports Source: www.drugs.indiana.edu/data-survey_icsus.html
Vets Search Engine Source: www.vetresources.org
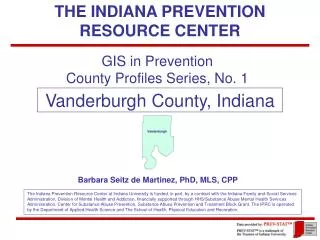
County Profiles http://www.drugs.indiana.edu/data-prevstat-county07.html Source
County Profiles Source: IPRC, GIS in Prevention, County Profiles, www.drugs.indiana.edu/search/prevstat_s07.php?page_group=51&tablenum=Intro5.0
IPRC Custom Reports • You select the geography/geographies • You select the variables/indicators • You select the year(s) • You select the formats (tables, maps) • You may get rates, ranks, to prevalence
Population Characteristics • Totals, Age, Gender, Race, Ethnicity • Citizenship • Educational Attainment • Marital Status • Employment Status, Industry, Occupation • Income and Poverty Status • Consumer Behavior, Leisure Activities • Etc.
Household Characteristics • Number • Types of Households • Household Size • Median Age of Householder • Household Income • Non-family households, group quarters • Seniors • Per Household Spending
Risk and Protective Factor Data:Community, Family, Neighborhood • Low Educational Attainment • Poverty (Child Poverty, TANF, Food Stamps) • Low bonding to Neighborhood • Family Management Problems/Conflict • Crime (FBI UCR and Crime Indices) • Transitions and Mobility • Lack of Health Insurance
Environmental Characteristics • Population Density • Risk and Protective Factors • Norms, Bonding, Values and Beliefs • Density of Alcohol / Tobacco Licenses • Means of Transportation & Travel Time to Work • Poverty • Community and School Risk Factors • Urbanicity • Units in Housing Structure (houses vs. high rise, 1-50 units, Mobile Home) and age of bldg
Trend Data • Changes in Population, count and percents • Past Censuses, Current Census, 2015 projection • Demographics • Population subgroups, seniors, youth, etc. • Households (#, persons/HH, age of HHer) • Housing (owner/renter occupied vs. vacant)
Consumer Spending per HH • Health care • Personal Insurance • Tobacco • Alcoholic Beverages • Fresh fruits, vegetables, sugar/sweets, fats/oils • Cereals, Bakery, Meat, and Dairy
Consumer Behaviors • Civic Activities • Smoking • Gambling • Have insurance • Crime (FBI UCR and Crime Indices)
Geographies • Smaller to Larger Context: County, State, U.S. • Neighborhood or City • Block Group, Census Tract, Zip code • Radius around an address • Custom defined neighborhood
At times . . . • Too much data can seem overwhelming. http://entertainment.webshots.com/photo/1041702010015901341YseGEP
Analysis Simplifies • Comparisons: • Town to county, state, nation • City to city, neighborhood to neighborhood • Trends over time • 2000 to 2010 • 2010 to 2015 projections • Rates (per 1,000 or 100,000) • Rankings (within Indiana, in the U.S.) • Use of Maps to convey information at a glance
Bottom Line … • Without data you won’t get very far. http://entertainment.webshots.com/photo/1040516516015901341VzRwAP
Contact us: 812-855-6776 812-855-1237 800-346-3077 seitzb@indiana.edu Thanks so much ! Indiana Prevention Resource Center 501 N. Morton St., Ste. 110 Bloomington, IN 47404