Download

1 / 20
280 likes | 885 Vues
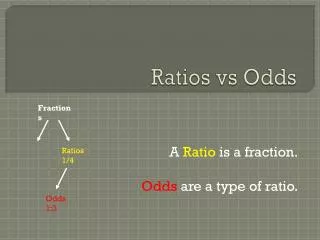
Relative Risk, Increased Risk, and Odds Ratios. Measures that allow us to compare two groups. Example: Plaque Breaks and Heart Attacks. The comparison. 0.68/0.21 = 3.24.

E N D
Relative Risk, Increased Risk,and Odds Ratios Measures that allow us to compare two groups ...
The comparison 0.68/0.21 = 3.24 “Men who died during strenuous activity were more than 3 times as likely to have ruptured plaque than men who engaged in normal activity.”
Relative risk Relative Risk = P(Diseased|Exposed) ÷ P(Diseased|Unexposed)
Example: Gender and Tattoos Rows: gender Columns: tattoo NY All M 74 16 90 82.22 17.78 100.00 F 79 8 87 90.80 9.20 100.00 All 153 24 177 86.44 13.56 100.00 Cell Contents -- Count % of Row
The comparison 0.1778/0.0920 = 1.93 “Males in Fall 1998 Stat 250 classes were almost twice (“2 times”) as likely to have a tattoo than females in Fall 1998 Stat 250 classes.”
Interpretation of relative risk Relative risk of 1 means that each “exposed” group is equally likely to have the “disease.” 10% of students who take Stat 250 appreciate statistics 10% of students who don’t take Stat 250 appreciate statistics RR of appreciating statistics = 0.10 /0.10 = 1
Interpretation of relative risk • If RR = 1, the exposed and unexposed groups are equally likely to get the disease. • If RR < 1, the exposed group is less likely to get the disease than the unexposed group. • If RR > 1, the exposed group is more likely to get the disease than the unexposed group.
Increased Risk as an alternative to Relative Risk • Relative risk is the “number of times more likely” one event is to occur over another. • Alternatively, can report the amount as a “percent more likely”. In this case, called “the increased risk.” • RR of 1 means a 0 percent increased risk. • To find increased (or decreased) risk, find percentage above (or below) 1.
Increased Risk What is the increased risk of male Stat 250 students having a tattoo over female Stat 250 students? 1.93 - 1.00 = 0.93 100 = 93% Males in Fall 1998 Stat 250 classes are 93 percent more likely to have a tattoo than females in Fall 1998 Stat 250 classes.
Increased risk Increased risk = (Relative Risk - 1.00) 100
Increased risk Increased risk can be negative! If so, it is a “decreased” risk. “Researchers found that occasional exercisers, those who did less than the equivalent of six brisk half-hour walks a month, were 0.70 times as likely to die than their sedentary twins.” Relative Risk = 0.70 Increased Risk = (0.70 - 1.00) × 100 = -30% “The researchers found that even occasional exercisers, were 30 percent less likely to die than their sedentary twins.”
Caution! • Relative risk and increased risk by themselves are not sufficient. Critical that you also know the conditional probabilities that went into calculating them. • RR = 0.005/0.001 = 5 • RR = 0.5/0.1 = 5 • Relative risk of 5 means two very different things in these two cases.
Odds • If P(event) is p, then odds of an event happening is “p/(1-p) to 1”. That is, the probability of the event happening over the probability of the event not happening. • Or, if m = # with a trait and n = # without the trait, then the odds of an event happening is “m/n to 1”. That is, the # with the trait over the # without the trait.
Interpreting odds Odds = 10 to 1 For every 10 students who didn’t sleep enough last night, I’ll find 1 who did sleep enough. Odds = 3 to 2 For every 3 students who do their homework daily, I’ll find 2 students who don’t do their homework daily.
Example: Gender and Tattoos Rows: gender Columns: tattoo NY All M7416 90 82.2217.78 100.00 F798 87 90.809.20 100.00 All 153 24 177 86.44 13.56 100.00 Cell Contents -- Count % of Row
Odds of Not Having a Tattoo For males 0.8222/0.1778 to 1 = 74/16 to 1 = 4.6 to 1 For every 4.6 males I find without a tattoo, I’ll find one male with a tattoo. For females 0.9080/0.0920 to 1 = 79/8 to 1 = 9.9 to 1 For every 9.9 females I find without a tattoo, I’ll find one female with a tattoo.
Odds ratio The ratio of two odds, that is, the odds for one group divided by the odds for another group.
The comparison Odds ratio = (79/8)/(74/16) = 9.9/4.6 = 2.15 The odds of finding a female without a tattoo is 2.15 times that of the odds of finding a male without a tattoo.
What to know? • Calculation of RR, IR, odds, OR • Interpretation of RR, IR, odds, OR • Relationship between RR and IR • Relationship between probability and odds • Importance of knowing probabilities and not just RR and IR