ASSOCIATION MAPPING WITH TASSEL
ASSOCIATION MAPPING WITH TASSEL. Presenter: VG SHOBHANA PhD Student CPMB. Genomics Effective tools Identify genes in pathways Alleles of agronomic traits Quite challenging ASSOCIATION MAPPING - high resolution

ASSOCIATION MAPPING WITH TASSEL
E N D
Presentation Transcript
ASSOCIATION MAPPING WITH TASSEL Presenter: VG SHOBHANAPhD Student CPMB
Genomics Effective tools Identify genes in pathways Alleles of agronomic traits Quite challenging ASSOCIATION MAPPING - high resolution - to evaluate wide range of alelles rapidly
Genetic Linkage • occurs when particular genetic loci or alleles for genes are inherited jointly • seen on the same chromosome • are physically connected • first discovered - British geneticists William Bateson and Reginald Punnett • Sturtvent - possiblility to obtain a measure for the distance between the genes - linkage map • A recombinant frequency (RF) of 1% is equivalent to 1 m.u.
Quantitative trait loci • Inheritance of a phenotypic characteristic - varies in degree - attributed to the interactions between two or more genes and their environment. • Stretches of DNA that are closely linked to the genes that underlie the trait. • QTLs can be molecularly identified (for example, with PCR or AFLP) to help map regions of the genome. • This can be an early step in identifying and sequencing these genes. • Their phenotypes typically vary along a continuous gradient depicted by a bell curve.
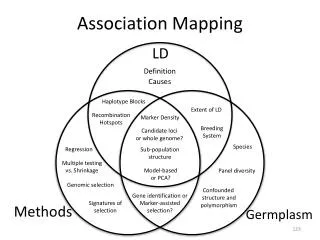
Linkage analysis Co- inheritance of neighbouring DNA variants (in both). Only few chances for recombination to occur. Low resolution of map. Association mapping Recombination is the main force of elimination of linkage. Recombination events occur over many generations. Eliminated linkage between a mutated gene. Only very close markers are in LD with the mutated gene. Differences: Linkage and Association
QTL mapping is the statistical study of the alleles that occur in a locus and the phenotypes (physical forms or traits) that they produce. Limitations of using natural populations: • It requires the growth of three generations before linkage analysis is possible. • Very large segregating populations are needed to achieve a high resolution map. • The molecular markers may be specific (polymorphic) to only one particular crossing family.
A complementary approach - to analyse Linkage Disequilibrium in natural populations. Successfully in humans - no large mapping families. LD between two loci in natural populations - affected by all the recombination events. Have happened since the two alleles appeared in some individuals of the population. LD declines as the number of generations increases, so that in old populations. LD is limited to small distances. This is desirable!! Since a marker very close to a mutation responsible for a disease makes it easier to reach the mutated gene.
Linkage disequilibrium is the correlation between pairs of polymorphisms. • One simple way to estimate linkage disequilibrium between pairs of sites is to calculate r2. • The average distance between polymorphisms, at which r2drops below 0.1 - a rough estimate of the resolution. • The rate of LD decay may also be locus specific as differences in recombination rate, mutation rate, and selection history can affect LD patterns.
-- LD measures the closeness of the genetic association between markers and a particular trait. -- May be used to identify markers in close proximity to the gene(s) responsible for the trait.
Association mapping is good for, • 5000 times higher resolution than using F2 populations • Surveys tens of alleles – while in standard methods – only a maximum of two alleles • Linkage disequilibrium and selection – keys to association analysis • Rely on • the extensive history of mutation • recombination to dissect a trait
Genotypic data 100 genotypes from each cluster – no closely related lines. One line from one taxon only. Has to be as diverse it could be – Extensive recombination history. 50 - 150 markers in a non random mated population – Good statistical power!! Modest number of SSRs large numbers of SNPs, AFLP may provide a good compromise Phenotypic data? Across 2-3 seasons in replications Materials
A standard procedure for association analysis on candidate genes: • 1. Select positional candidate genes using existing QTL and positional cloning studies • 2. Choose germplasm that will capture the bulk of diversity present. (When possible, use inbred lines) • 3. Score phenotypic traits in replicated trials • 4. Amplify and sequence candidate genes • 5. Manipulate sequence into valid alignments and identify • polymorphisms • 6. Obtain diversity estimates and evaluate patterns of selection • 7. Statistically evaluate associations between genotypes and phenotypes taking population structure into account
Sequence Manipulation Softwares • Phred and Phrap (http://www.codoncode.com/) - to assess sequence quality and contig (join) sequences • Biolign (http://www.mbio.ncsu.edu/BioEdit/bioedit.html) - to edit multiple alignments of contigs and evaluate SNPs (custom software package) • MegAlign from DNASTAR • Sequencher from GeneCodes (http://www.genecodes.com) offer similar features
Association Analysis Software Population Structure: STRUCTURE (http://pritch.bsd.uchicago.edu) Linkage Disequilibrium: • Arlequin (http://lgb.unige.ch/arlequin) • TASSEL (http://www.maizegenetics.net) (ANOVA and regression analysis) • PowerMarker (http://www.statgen.ncsu.edu) • DnaSP (http://www.bio.ub.es/~julio/DnaSP.html) STRAT - (http://pritch.bsd.uchicago.edu) - for testing association of binary traits across structured populations SAS (http://www.sas.com) carries out a wide range of statistics useful for association analysis.
TASSEL Trait Analysis by aSSociation, Evolution and Linkage
Analysis Mode Result Mode
Conclusions • Mapping with F2 or derived populations is powerful for evaluating two alleles with low resolution. • Association analysis can evaluate numerous alleles at high resolution. • These two approaches are complementary. • The successful integration - will allow the rapid dissection of almost any trait within a few years time. • The key to association analysis is the choice of germplasm, quality of phenotypic data, and use of statistical analyses to control for population structure. • The combination of association mapping and QTL mapping could make it routine to dissect complex traits.