
Uploaded by
vilina
2 SLIDES
114 VUES
20LIKES
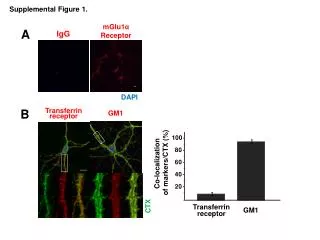
Co-localization Analysis of mGlu1α Receptor and Cell Markers
DESCRIPTION
This supplemental figure illustrates the co-localization of mGlu1α receptor with various cell markers using immunofluorescence and quantification methods. The figure also shows the impact of Tat-blocking peptides on mGlu1α receptor localization.
Download
1 / 2
Télécharger la présentation 
Co-localization Analysis of mGlu1α Receptor and Cell Markers
An Image/Link below is provided (as is) to download presentation
Download Policy: Content on the Website is provided to you AS IS for your information and personal use and may not be sold / licensed / shared on other websites without getting consent from its author.
Content is provided to you AS IS for your information and personal use only.
Download presentation by click this link.
While downloading, if for some reason you are not able to download a presentation, the publisher may have deleted the file from their server.
During download, if you can't get a presentation, the file might be deleted by the publisher.
E N D
Presentation Transcript
Supplemental Figure 1. mGlu1α Receptor A IgG 100 80 DAPI Co-localization of markers/CTX (%) 60 B GM1 Transferrin receptor 40 20 Transferrin receptor GM1 CTX
Supplemental Figure 2. A Tat-blocking Tat-mutant Control IP : mGlu1α Caveolin mGlu1α B DHPG 0.90 0.80 Control Tat-blocking peptide Tat-mutant peptide Fura-2 340/380 ratio 0.70 0.60 0.50 0 100 200 300 400 500 (Sec)


More Related