Performance-Based Planning
420 likes | 700 Vues
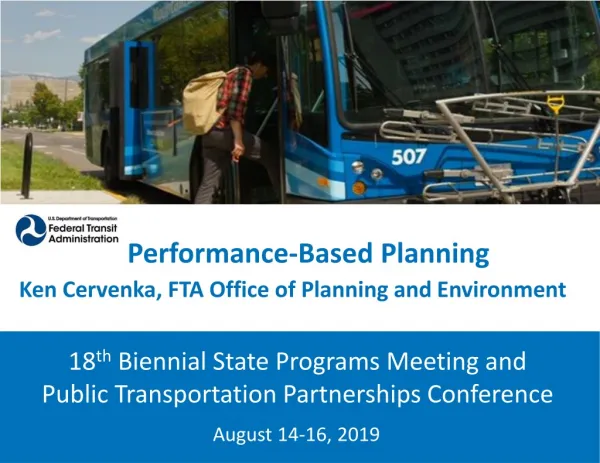
Performance-Based Planning. Ken Cervenka, FTA Office of Planning and Environment. 18 th Biennial State Programs Meeting and Public Transportation Partnerships Conference. August 14-16, 2019. Overview. 18 th Biennial State Programs Meeting and Public Transportation Partnerships Conference.

Performance-Based Planning
E N D
Presentation Transcript
Performance-Based Planning Ken Cervenka, FTA Office of Planning and Environment 18th Biennial State Programs Meeting and Public Transportation Partnerships Conference August 14-16, 2019
Overview 18th Biennial State Programs Meeting and Public Transportation Partnerships Conference August 27-28, 2019 Performance-Based Planning and Programming (PBPP) requirements and framework Transit Asset Management in PBPP Public Transportation Safety in PBPP Example: Transit Asset and Safety Management in PBPP
Performance Management Requirements 18th Biennial State Programs Meeting and Public Transportation Partnerships Conference August 27-28, 2019 MAP-21 and the FAST Act require USDOT, States, Metropolitan Planning Organizations (MPOs) and public transportation providers to implement a performance management approach for Federally-supported highways and transit
Performance Management Requirements 18th Biennial State Programs Meeting and Public Transportation Partnerships Conference August 27-28, 2019 Why? Prioritize needs Align resources to optimize system performance, collaboratively Increase accountability and transparency
Performance Management Framework MAP-21 establishes seven national performance goals in safety, infrastructure condition, congestion, system reliability, emissions, and freight movement. USDOT (FTA and FHWA) establish national performance measures. State DOTs and transit providers develop performance targets and performance-based plans. MPOs coordinate with States and transit providers to integrate performance targets and plans into planning documents.
Relevant Statutory Provisions,Rules and Guidance Transit Asset Management (TAM) 49 C.F.R.§625 • TAM Plan • Definition of “state of good repair” (SGR) • SGR Performance Measures and Targets • NTD Reporting §5326 §134 §135 Statewide & Metro Planning, Non-Metro Planning • Define Coordination for Target Selection, Planning and Programming Public Transportation Agency Safety Plan (PTASP) 49 C.F.R.§673 §5329 • Agency Safety Plan • Safety Performance Targets National Public Transportation Safety Plan • Safety Performance Measures §5329
What is Transit Asset Management? 18th Biennial State Programs Meeting and Public Transportation Partnerships Conference August 27-28, 2019 Transit Asset Management (TAM) is a business model that uses the condition of assets to guide the optimal prioritization of funding at transit properties in order to keep our transit networks in a State of Good Repair (SGR)
What is Transit Asset Management? 18th Biennial State Programs Meeting and Public Transportation Partnerships Conference August 27-28, 2019 Consequences of not being in a State of Good Repair include: Unacceptable safety risk Decreased system reliability Higher maintenance costs Lower system performance
TAM Background 18th Biennial State Programs Meeting and Public Transportation Partnerships Conference August 27-28, 2019 TAM Final Rule provides a foundation for addressing the SGR backlog Focuses on measuring and monitoring performance and condition Minimizes burden on smaller transit providers Two tier approach with fewer elements for small/rural
TAM Background 18th Biennial State Programs Meeting and Public Transportation Partnerships Conference August 27-28, 2019 High-Level Requirements of TAM Rule: TAM Plan Performance measure targets Self-certification of compliance Coordination with planning
Two Types of Deliverables Reports • Data report • Performance targets • Performance status • Condition Assessments • Inventory • Narrative report Process • Compliant TAM Plan • Group • Individual Tier 1 • Individual Tier II • Recordkeeping & Coordination with Planning • Certification
TAM Plan Elements * Inventory of CapitalAssets ConditionAssessment DecisionSupportTools Investment Prioritization AllProviders (TierI &II) TAMandSGRPolicy ImplementationStrategy ListofKeyAnnualActivities Identification of Resources EvaluationPlan TierIonly OperatesRail OR ≥101 vehiclesacrossallfixedroutemodes OR ≥101 vehiclesinonenon-fixedroutemode *FTAestimates thatfewerthan20%oftransitproviderswilldoaTierI Plan
TAM in a Transit Agency’s Planning and Programming Process • TAM Outputs • Performance Mitigation Strategies/Targets • Costs Start HERE • TAM Plan • Asset Inventory w/ Condition Assessment • Investment Prioritization • SGR Targets Safety Management Program Outputs • TAM Program • Condition Assessment Monitoring • Asset Rehabilitation and Replacement • Policies Capital Planning Operational Planning Accountable Executive signs TAM Plan Budget and strategic plans are approved by Board of Directors Key outputs and reports are shared with external planning processes
PTASP Background 18th Biennial State Programs Meeting and Public Transportation Partnerships Conference August 27-28, 2019 Congress required operators of public transportation systems that receive FTA funds to develop and implement a Public Transportation Agency Safety Plan (49 U.S.C. § 5329(d)) Final Rule (49 C.F.R. Part 673) published on July 19, 2018 Compliance date is July 20, 2020
PTASP Background 18th Biennial State Programs Meeting and Public Transportation Partnerships Conference August 27-28, 2019 Transit agencies must implement a Safety Management System (SMS) by developing and documenting SMS processes in their Agency Safety Plan
Safety Management System (SMS) 18th Biennial State Programs Meeting and Public Transportation Partnerships Conference August 27-28, 2019 Formal, top-down, organization-wide approach to managing safety risk and assuring the effectiveness of a transit agency’s safety risk mitigation
Safety Management System (SMS) 18th Biennial State Programs Meeting and Public Transportation Partnerships Conference August 27-28, 2019 Includes systematic procedures, practices, and policies for managing risks and hazards that help: Control risk better Detect and correct safety problems earlier Share and analyze safety data more effectively Measure safety performance more carefully
PTSAP Applicability and Requirements Safety Management System (SMS) Safety Performance Targets Rail Agencies Only: Emergency Preparedness Plan Public Transportation Agency Safety Plan Employee Reporting Program • Approved by Accountable Executive and Board of Directors (and SSOA for rail transit agencies) • Annual Review/Update • Compliance with Public Transportation Safety Program/National Safety Plan • Assignment of Chief Safety Officer
PTASP in a Transit Agency’s Planning and Programming Process Accountable Executive signs Agency Safety Plan and the Board approves • Budget and strategic plans are approved by Board of Directors • Key outputs and reports are shared with external planning processes • PTASP Outputs • Safety Performance Targets • Safety Risk Mitigations • Costs • Agency Safety Plan • Establishes safety management program • Establishes safety performance targets Transit Asset Management Outputs Capital Planning • Safety Management System • Identify safety hazards • Evaluate risk mitigations • Assign resources to address unacceptable safety risk Operational Planning
Simplified Performance-Based Planning and Programming (PBPP) Cycle Where do we want to go? How can we get there? How did we do? Keys to Success • Quality data • Public involvement What will it take to get there?
Transit Asset and Safety Managementin PBPP • States and public transit providers: • Carry out these activities to manage transit assets and safety • Develop inputs for and engage in broader PBPP efforts with MPOs and USDOT
Planning • Strategic Direction • Set goals and objectives • Develop performance measures • Strategic Analysis • Identify insights and trends • Set performance targets • Coordinate performance targets “to the maximum extent practicable” • Consider alternatives • Develop investment priorities
TAM in Planning • Performance Measures • USDOT set four TAM performance measures for the condition of capital assets. • Performance Targets • SGR targets reported annually to NTD • Individual providers or group plan sponsors of multiple providers • For applicable asset classes in the four asset categories • Made available to MPO and State DOT • Submit with regular NTD report
PTASP in Planning • Performance Measures • USDOT sets performance measures for safety performance in the National Public Transportation Safety Plan • Performance Targets • Transit providers set safety performance targets for each measure • Targets are shared with the MPO and State DOT
Transit Safety Performance Measures Category Criteria FATALITIES Total number of reportable fatalities and rate per total revenue miles by mode INJURIES Total number of reportable injuries and rate per total vehicle revenue miles by mode SAFETY EVENTS Total number of reportable events and rate per total vehicle revenue miles by mode SYSTEM RELIABILITY Mean distance between major mechanical failures by mode
Planning • States receive safety performance targets from transit agencies to incorporate in to their STIPs • MPOs are required to set initial safety targets no more than 180 days after receipt of the transit safety plans from the providers, which include the providers’ targets • If the transit safety plans are shared on July 20, 2020, the MPO’s initial targets are required to be set by January 20, 2021
Programming • Develop plans that link investment priorities to performance targets • Integrate different performance-based plans • Develop a program of projects • Allocate resources
TAM in Programming • Transit providers and States develop TAM Plans with investment priorities to improve the SGR of capital assets • TAM Plans by October 1, 2018 (or later, if FTA approved an extension) • Individual providers or group sponsors of multiple providers • Sent to MPO and State DOT, and updated at least every four years
PTASP in Programming • Transit Safety Plans completed and certified by July 20, 2020 • Individual providers (only 5307 recipients and sub-recipients) and rail transit agencies • No FTA extensions to be granted • Transit agencies review plans each year, for possible update • Includes safety performance targets
Programming • States and MPOs develop Statewide Transportation Improvement Programs (STIPs) and Transportation Improvement Programs (TIPs) to achieve all performance targets • States and MPOs describe anticipated effects of STIPs and TIPs to make progress toward achieving performance targets in Long-Range Statewide Transportation Plans and Metropolitan Transportation Plans
Programming • The first descriptions of the anticipated effect of investments in the Transportation Improvement Program (TIP) • Triggered by the first TIP update or amendment after October 1, 2018 (TAM) or July 20, 2021 (PTASP) • The second descriptions • Triggered by the next TIP update (not amendment)
Evaluation • Implement plans and projects • Monitor activities • Evaluate performance • Report outcomes
TAM in Evaluation • Annual reports to the National Transit Database (NTD) • Individual providers report based on fiscal year • Inventory & conditions of transit assets • Transit SGR targets • Narrative report of annual changes (starting 2019)
PTASP in Evaluation • Transit providers already submit reports to the National Transit Database (NTD) • Fatalities, Injuries and Safety Events (each fiscal year) • Total revenue miles by mode (each fiscal year) • Does not include “Mean distance between major mechanical failures” • Does not include targets
PTASP and TAM in Evaluation • The first MPO system performance report • Is a baseline of the existing conditions and targets • Triggered by the first long-range plan update or amendment after • First TAM Plan - October 1, 2018 • First PTASP- July 20, 2021 • Can include the MPO’s initially-prepared targets, or updated targets • Based on the TAM and future-Safety measures in respective plans
PTASP and TAM in Evaluation • The second MPO system performance report • Triggered by the next long-range plan update (not an amendment) • Describes how the latest (existing) conditions have changed since the baseline report, and how they compare to the targets identified in the first baseline report • Also contains updated transit performance targets
Example: Transit Asset and Safety Management in PBPP Through the annual target setting process for rolling stock, City Transit Agency finds that X model bus fleet has exceeded its ULB. Which initiates a Safety Risk Assessment through SMS process, City Transit Agency finds that there are a high number of pedestrian injuries along bus route Y due to high levels of pedestrian and vehicle traffic and fleet X also has an obsolete radio system. The agency proposes a safety mitigation of moving the bus stops and modifying bus operator training to reduce the safety risk, in addition to purchasing new rolling stock with newer radio system. City Transit Agency shares TAM and safety investment priorities and performance targets with State and MPO. The MPO leads a process to determine that the high safety risk bus route should be converted to a BRT operation, with new buses purchased for the BRT to replace the fleet over its ULB.
Resources 18th Biennial State Programs Meeting and Public Transportation Partnerships Conference www.transit.dot.gov/performance-based-planning Frequently Asked Questions Fact Sheet www.transit.dot.gov/regulations-and-guidance/safety/transit-safety-oversight-tso Guidance on Transit Safety Plans Transit Safety Plan Template for Bus Transit www.transit.dot.gov/TAM