Download
1 / 39
390 likes | 564 Vues
Traumatic Brain Injury in Nebraska 2004-2008. CSTE Annual Conference ▪ June 14, 2011. Ericka Welsh, PhD Nebraska Injury Prevention and Control Program. Introduction.

E N D
Traumatic Brain Injury in Nebraska 2004-2008 CSTE Annual Conference ▪ June 14, 2011 Ericka Welsh, PhD Nebraska Injury Prevention and Control Program
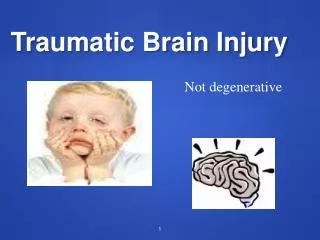
Introduction • Traumatic brain injury (TBI) is caused by a bump, blow or jolt to the head or a penetrating head injury that disrupts the normal function of the brain. • Each year, about 1.7 million Americans sustain a TBI; about 52,000 die as a result. • Currently, about 5.3 million Americans are living with a TBI-related disability, and 85,000 persons each year will sustain a TBI that results in a permanent disability.
Traumatic Brain Injury in Nebraska 2004-2008 report and fact sheet • Created to inform public health practitioners, policymakers, and the general public about the burden of TBI in Nebraska in order to design and implement effective preventive measures against TBI.
Objectives • Describe the burden of TBI-related deaths, hospitalizations, and emergency department (ED) visits in Nebraska • Frequencies and age-adjusted rates • 5-year trends • Age-specific rates • Leading causes, by gender • Median hospital charge and expected primary payer • Highlight current initiatives in Nebraska to prevent and control TBI
Data source • Nebraska death certificates • Provided by the NDHHS Office of Vital Statistics • Multiple cause-of-death • Classify injuries by external cause of death
Data source • Hospital discharge data (HDD) • Data collected via 2004 Uniform Billing form (UB-04) • Provided by Nebraska acute care hospitals to the Nebraska Hospital Association (NHA) • E-code data, a subset of HDD containing injury related records, is provided to the Nebraska DHHS by the NHA
Case definitions • TBI-related deaths and hospitalizations CDC State Injury Indicators: Instructions for Preparing 2005 Data (2007)
Case definitions Deaths with ANY of the following International Classification of Diseases (ICD)-10 codes in ANY field of the multiple cause of death file:
Case definitions Hospital discharges with ANY of the following ICD-9-CM diagnostic codes in ANY of the diagnostic fields of the injury hospital discharge (E-code) subset:
Notes • All results are based on deaths and hospital discharges of Nebraska residents. Nebraska residents who died or were treated at hospitals out of state are not included. • Frequencies and rates reflect numbers of discharge records, rather than numbers of patients discharged. • Five-year averages are used to provide more stable rates by reducing the effects of fluctuations from year to year.
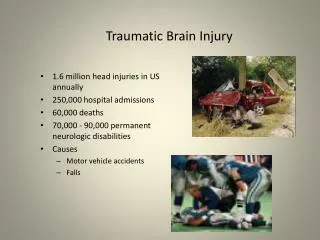
Frequencies and age-adjusted rates, Nebraska residents, 2004-2008 1,610 deaths AA rate= 17.4 per 100,000 pop. AA rate=50.9 per 100,000 pop. 4,750 hospitalizations AA rate=337 per 100,000 pop. 30,265 ED visits ??? Other medical care ??? No medical care
Age-adjusted rates for TBI-related deaths by year, Nebraska residents, 2004-2008
Age-adjusted rates for TBI-related hospitalizations by year, Nebraska residents, 2004-2008
Age-adjusted rates for TBI-related ED visits by year, Nebraska residents, 2004-2008
A closer look at increasing trends... • Increasing trends similar for 2000-2009 data • From 2000 to 2009: • 115% increase for TBI-related ED visits • 40% increase for TBI-related hospitalizations
A closer look at increasing trends... • From 2005 to 2008: • ~12% increase for injury-related ED visits w/out TBI, but ~52% increase for injury-related ED visits w/ TBI • Greater relative increases among certain causes: MVT, falls, struck by/against, and not specified • Greatest relative increase within “unspecified head injury” category
Age-specific rates for TBI-related deaths, Nebraska residents, 2004-2008
Age-specific rates for TBI-related hospitalizations, Nebraska residents, 2004-2008
Age-specific rates for TBI-related ED visits, Nebraska residents, 2004-2008
TBI-related deaths, by cause and gender, Nebraska residents, 2004-2008 Among TBI-related deaths due to firearm injuries, 82% were suicide, 15% were homicide, and the remaining 3% were unintentional or undetermined intent.
TBI-related hospitalizations, by cause and gender, Nebraska residents, 2004-2008
TBI-related ED visits, by cause and gender, Nebraska residents, 2004-2008 Percent of TBI-related ED visits that were sports-related: 3.5% among females, 11.5% among males.
TBI-related hospitalizations, by expected primary payer, Nebraska residents, 2004-2008 • From 2004 to 2008, the median hospital charge for TBI-related hospitalizations was $17,152.
TBI-related ED visits, by expected primary payer, Nebraska residents, 2004-2008 • From 2004 to 2008, the median hospital charge for TBI-related ED visits was $1,664.
Summary • From 2004- 2008: • Rates for TBI-related death remained relatively stable, while TBI-related hospitalizations and ED visits increased. • Increased coding of “unspecified head injury” • TBI-related death and hospitalization rates were highest among older adults; TBI-related ED visits were highest among infants, young children, adolescents, and older adults.
Summary • From 2004- 2008: • The leading causes of TBI-related deaths were motor vehicle crashes, falls, and firearms (esp. for males). • The leading causes of TBI-related hospitalization and ED visits were falls, motor vehicle crashes, and stuck/by against injuries. • For males, slightly more than 1 in 10 TBI-related ED visits are sports-related
Brain Injury Association of Nebraska • NE-BIA director is a member of the Injury Community Planning Group • DHHS working closely with NE-BIA to promote newly passed Nebraska Concussion Awareness Act
Nebraska Concussion Awareness Act (LB260) • Signed into law April 14, 2011 • Prohibits youth who suffer concussions in school-sponsored athletics and in programs run by cities, businesses and nonprofit groups from playing or practicing until cleared by a healthcare professional • Requires that coaches receive training on the warning signs of concussion • Workgroup formed to decide how to best promote to coaches and healthcare professionals
Preventing leading causes of TBI • Motor vehicle crashes • Distracted driving among teen drivers • Older adult falls • Tai Chi: Moving for Better Balance
Acknowledgements • Data support • Jennifer Marcum, DrPH • Alan Xu • Ming Qu, PhD • Program support • Peg Ogea-Ginsburg • Jason Kerkman, MPH • Data providers
Questions? • Contact information: Ericka Welsh, PhD ericka.welsh@nebraska.gov (402) 471-1063 • Website: http://www.dhhs.ne.gov/hew/hpe/Injury/facts.htm