Analyzing Financial Data
This detailed lesson on financial data analysis focuses on understanding and analyzing key financial statements: the Income Statement, Balance Sheet, Statement of Stockholders' Equity, and Statement of Cash Flows. It introduces the different categories of financial ratios, including liquidity, activity, debt, profitability, and market ratios. Learn how these ratios can evaluate a firm's performance, their limitations, and apply practical examples to solidify your understanding of financial health assessment. Explore how to calculate and interpret critical financial metrics.

Analyzing Financial Data
E N D
Presentation Transcript
Analyzing Financial Data Ratio Analysis
Lesson Components • Four Key Financial Statements • Ratio Overview • Ratio Categories • Liquidity • Activity • Debt • Profitability • Market • Practice
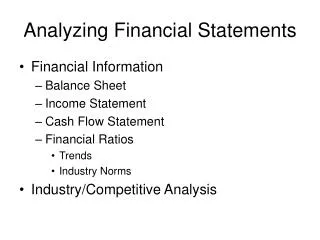
Four Key Financial Statements Each corporation is required to file with the Securities and Exchange Commission (SEC) four key financial statements: • Income statement: • provides a financial summary of the company’s operating results over a specified period of time. • Balance sheet: • provides a summary statement of the company’s financial position at a given point in time. • Statement of Stockholders’ Equity: • shows all the equity account transactions in a given year. • Statement of Cash Flows: • summary of cash flows of a given period of time.
Learning Statements • These financial statements are also used in order to do ratio analysis to examine the performance of a firm. Income Statement Sample Accounts Sales COGS Operating Expenses Selling Expenses Interest Expense Earnings before Interest & Taxes (EBIT) Net Income Balance Sheet Sample Accounts Cash Accounts Payable Accounts Receivable Notes Payable InventoriesAccruals Total Current Assets Total Current Liability Land and Buildings Preferred Stock Machinery & Equipment Common Stock Vehicles Retained Earnings
Ratio Overview • Many internal and external stakeh0lders use ratios • A ratio is not enough information on its own. • Several limitations exist to ratio analysis • Seasonality • Inflation • Summarization • Asset valuation
Five Categories of Ratios • Liquidity • Activity • Debt • Profitability • Market
Liquidity Ratios Liquidity is the company’s ability to pay its short-term bills Current ratio Current assets/Current liabilities $72,000/$69,000 = ??? Quick ratio Current assets-inventory/Current liabilities $72,000-45,500/$69,000 =???
Activity Ratios Activity is a measure of how quickly the firm’s current assets are converted into cash. Inventory Turnover COGS /Avg Inventory $106,000/ $45,500=??? Average Collection Period Accts rec/(Annual sales/365) $25,000/(160,000/365)=??? Total Asset Turnover Sales/ Total Assets $160,000 $150,000=???
Used to determine whether the firm is able to meet long-term financial obligations. Debt Ratios Debt Ratio Total liabilities/ Total assets $91,950/ $150,000 =??? Times Interest Earned Ratio EBIT/ Interest expense $17,000/ 6,100 =???
Measure how well management is utilizing company resources to earn a return on the funds invested by various groups Profitability Ratios Gross Profit Margin (Sales-COGS)/ Sales ($160,000-106,000)/$160,000 =?? Operating Profit Margin EBIT or Operating Income/Sales $17,000/160,000=?? Net Profit Margin Net Income/Sales $6,540/160,000=?? Earnings per Share Net Income/Shares Outstanding $6,540/3,000=?? Return on Total Assets Net Income/ Total Asset $6,540/150,000=?? Return on Equity Net Income/Shareholder Equity $6,540/31,500=??
This set measures how well the firm is doing in terms of the stock price and risk and return Market Ratios Price Earnings Ratio Market price per share common stock/ EPS $25/$2.18 = ??? Market/Book Ratio Market price per share common stock/(Shareholder Equity/shares outstanding) $25/($31,500/3000) =???
Check Your Understanding Which of the following measure a company’s liquidity without considering inventory? a. Current ratio b. Rapid test ratio c. Quick ratio d. Inventory ratio