Download
1 / 29
320 likes | 524 Vues
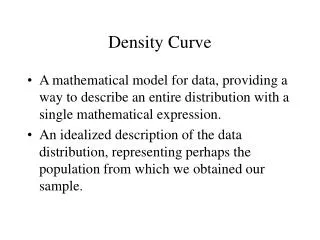
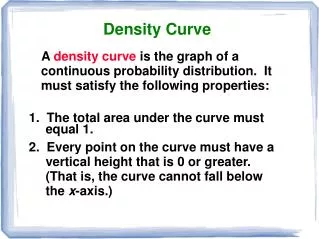
A density curve is the graph of a continuous probability distribution. Basic Properties of the Standard Normal Curve. 1. The total area under the standard normal curve is 1.

E N D
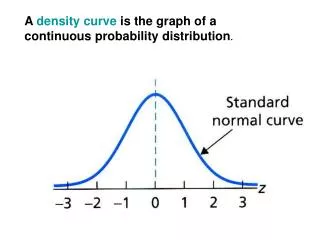
A density curve is the graph of a continuous probability distribution.
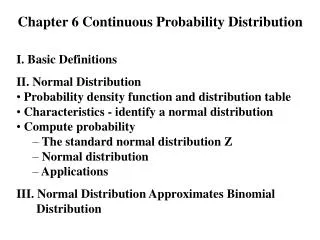
Basic Properties of the Standard Normal Curve 1. The total area under the standard normal curve is 1 2. The standard normal curves extends indefinitely in both directions, approaching, but never touching , the horizontal axis. 3. The standard normal curve is symmetric about 0. 4. Almost all the area under the standard normal curve lies between -3 and 3.
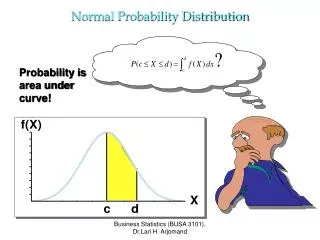
Because the total area under the density curve is equal to 1, there is a correspondence between area and probability
If thermometers have an average (mean) reading of 0 degrees and a standard deviation of 1 degree for freezing water, and if one thermometer is randomly selected, find the probability that, at the freezing point of water, the reading is less than 1.58 degrees 94.29% of the thermometers have readings less than 1.58 degrees.
94.29% of the thermometers have readings less than 1.58 degrees.
If Z is a standard normal variable, find the probability that Z lies between 0.7 and 1.98. • 0.2175 • -0.2181 • 1.7341 • 0.2181
If Z is a standard normal variable, find the probability that Z lies between 0.7 and 1.98. • 0.2175 • -0.2181 • 1.7341 • 0.2181
Finding z Scores When Given Probabilities (z score will be positive) Z = 1.645
x– z = Converting to a Standard Normal Distribution
The safe load for a water taxi was found to be 3500 pounds. All passengers are men. Assume also that the weights of the men are normally distributed with a mean of 172 pounds and standard deviation of 29 pounds. If one man is randomly selected, what is the probability he weighs less than 174 pounds?
= 172 =29 174 – 172 z = = 0.07 29
P ( x < 174 lb.) = P(z < 0.07) = 0.5279