Download

1 / 37
370 likes | 502 Vues
This guide explores the fundamentals of selecting probability distributions for quantitative risk assessment. It emphasizes the importance of understanding both the data and the variables involved, including whether they are continuous or discrete, and their potential bounds. Learn to effectively fit empirical distributions to data and the implications of distribution choice on results. It also covers the distinction between parametric and non-parametric distributions, providing a checklist to aid in decision-making. Utilize the appropriate theories, past experiences, and sensitivity analyses to enhance your risk assessment approaches.

E N D
Institute for Water Resources 2010 Choosing a Probability Distribution Charles Yoe, Ph.D.
Probability x Consequence • Quantitative risk assessment requires you to use probability • Sometimes you will estimate the probability of an event • Sometimes you will use distributions to • Describe data • Model variability • Represent our uncertainty • What distribution do you use?
Probability—Language of Random Variables • Constant • Variables • Some things vary predictably • Some things vary unpredictably • Random variables • It can be something known but not known by us
Checklist for Choosing a Distributions From Some Data • Can you use your data? • Understand your variable • Source of data • Continuous/discrete • Bounded/unbounded • Meaningful parameters • Do you know them? (1stor 2ndorder) • Univariate/multivariate • Look at your data—plot it • Use theory • Calculate statistics • Use previous experience • Distribution fitting • Expert opinion • Sensitivity analysis
First! • Do you have data? • If so, do you need a distribution or can you just use your data? • Answer depends on the question(s) you’re trying to answer as well as your data
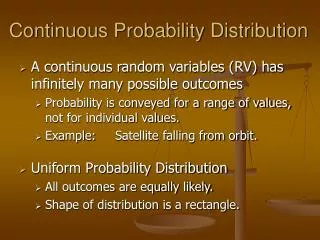
Use Data • If your data are representative of the population germane to your problem use them • One problem could be bounding data • What are the true min & max? • Any dataset can be converted into a • Cumulative distribution function • General density function
Fitting Empirical Distribution to Data • If continuous & reasonably extensive • May have to estimate minimum & maximum • Rank data x(i) in ascending order • Calculate the percentile for each value • Use data and percentiles to create cumulative distribution function
When You Can’t Use Your Data • Given wide variety of distributions it is not always easy to select the most appropriate one • Results can be very sensitive to distribution choice • Using wrong assumption in a model can produce incorrect results=>poor decisions=> undesirable outcomes
Understand Your Data • What is source of data? • Experiments • Observation • Surveys • Computer databases • Literature searches • Simulations • Test case The source of the data may affect your decision to use it or not. Understand your variable
Barges in a tow • Houses in floodplain • People at a meeting • Results of a diagnostic test • Casualties per year • Relocations and acquisitions • Average number of barges per tow • Weight of an adult striped bass • Sensitivity or specificity of a diagnostic test • Transit time • Expected annual damages • Duration of a storm • Shoreline eroded • Sediment loads Type of Variable? • Is your variable discrete or continuous ? • Do not overlook this! • Discrete distributions- take one of a set of identifiable values, each of which has a calculable probability of occurrence • Continuous distributions- a variable that can take any value within a defined range Understand your variable
What Values Are Possible? • Is your variable bounded or unbounded? • Bounded-value confined to lie between two determined values • Unbounded-value theoretically extends from minus infinity to plus infinity • Partially bounded-constrained at one end (truncated distributions) • Use a distribution that matches Understand your variable
Unbounded Normal t Logistic Left Bounded Chi-square Exponential Gamma Lognormal Weibull Bounded Beta Cumulative General/histogram Pert Uniform Triangle Continuous Distribution Examples Understand your variable
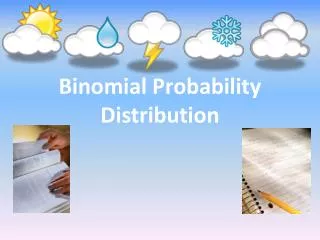
Unbounded None Left Bounded Poisson Negative binomial Geometric Bounded Binomial Hypergeometric Discrete Discrete Uniform Discrete Distribution Examples Understand your variable
Are There Parameters • Does your variable have parameters that are meaningful? • Parametric--shape is determined by the mathematics describing a conceptual probability model • Require a greater knowledge of the underlying • Non-parametric—empirical distributions for which the mathematics is defined by the shape required • Intuitively easy to understand • Flexible and therefore useful Understand your variable
Choose Parametric Distribution If • Theory supports choice • Distribution proven accurate for modelling your specific variable (without theory) • Distribution matches any observed data well • Need distribution with tail extending beyond the observed minimum or maximum Understand your variable
Choose Non-Parametric Distribution If • Theory is lacking • There is no commonly used model • Data are severely limited • Knowledge is limited to general beliefs and some evidence Understand your variable
Parametric and Non-Parametric • Normal • Lognormal • Exponential • Poisson • Binomial • Gamma • Uniform • Pert • Triangular • Cumulative Understand your variable
Do You Know the Parameters? • Probability distribution with precisely known parameters (N(100,10)) is called a 1st order distribution • Probability distribution with some uncertainty about its parameters(N(m,s)) is called a 2ndorder distribution • Risknormal(risktriang(90,100,103),riskuniform(8,11)) Understand your variable
Is It Dependent on Other Variables • Univariate and multivariate distributions • Univariate--describes a single parameter or variable that is not probabilistically linked to any other in the model • Multivariate--describe several parameters that are probabilistically linked in some way • Engineering relationships are often multivariate Understand your variable
Continuing Checklist for Choosing a Distributions • Look at your data—plot it • Use theory • Calculate statistics • Use previous experience • Distribution fitting • Expert opinion • Sensitivity analysis
Plot--Old Faithful Eruptions • What do your data look like? • You could calculate Mean & SD and assume its normal • Beware, danger lurks • Always plot your data
Which Distribution? • Examine your plot • Look for distinctive shapes of specific distributions • Single peaks • Symmetry • Positive skew • Negative values • Gamma, Weibull, beta are useful and flexible forms
Theory-Based Choice • Most compelling reason for choice • Formal theory • Central limit theorem • Theoretical knowledge of the variable • Behavior • Math—range • Informal theory • Sums normal, products lognormal • Study specific • Your best documented thoughts on subject
Calculate Statistics • Summary statistics may provide clues • Normal • Low coefficient of variation • Equal mean and median • Exponential has positive skew • Equal mean and standard deviation • Consider outliers
Outliers • Extreme observations can drastically influence a probability model • No prescriptive method for addressing them • If observation is an error remove it • If not what is data point telling you? • What about your world-view is inconsistent with this result? • Should you reconsider your perspective? • What possible explanations have you not yet considered?
Outliers (cont) • Your explanation must be correct, not merely plausible • Consensus is poor measure of truth • If you must keep it and can't explain it • Use conventional practices and live with skewed consequences • Choose methods less sensitive to such extreme observations (Gumbel, Weibull)
Previous Experience • Have you dealt with this issue successfully before? Have others? • What did other analyses or risk assessments use? • What does the literature reveal?
Goodness of Fit • Provides statistical evidence to test hypothesis that your data could have come from a specific distribution • H0 these data come from an “x” distribution • Small test statistic and large p mean accept H0 • It is another piece of evidence not a determining factor
GOF Tests • Chi-Square Test • Most common—discrete & continuous • Data are divided into a number of cells, each cell with at least five • Usually 50 observations or more • Kolomogorov-Smirnov Test • More suitable for small samples than Chi-Square • Better fit for means than tails • Andersen-Darling Test • Weights differences between theoretical and empirical distributions at their tails greater than at their midranges • Desirable when better fit at extreme tails of distribution are desired
Kolmogorov-Smirnov Statistic • Blue = data • Red = true/hypothetical • Find biggest difference between the two • K-S statistic is largest difference consistent with your • n • α
Defining Distributions w/ Expert Opinion • Data never collected • Data too expensive or impossible • Past data irrelevant • Opinion needed to fill holes in sparse data • New area of inquiry, unique situation that never existed
What Experts Estimate • The distribution itself • Judgment about distribution of value in population • E.g. population is normal • Parameters of the distribution • E.g. mean is x and standard deviation is y
Modeling Techniques • Disaggregation (Reduction) • Subjective Probability Elicitation • PDF or CDF • Parametric or Non-parametric distributions
Elicitation Techniques Needed • Literature shows we do not assess subjective probabilities well • In part due to heuristics we use • Representativeness • Availability • Anchoring and adjustment • There are methods to counteract our heuristics and to elicit our expert knowledge
Sensitivity Analysis • Unsure which is the best distribution? • Try several • If no difference you are free to use any one • Significant differences mean doing more work
Take Away Points • Choosing the best distribution is where most new risk assessors feel least comfortable. • Choice of distribution matters. • Distributions come from data and expert opinion. • Distribution fitting should never be the basis for distribution choice.
Questions? Charles Yoe, Ph.D. cyoe1@verizon.net