Understanding Probability Distributions: Key Concepts and Applications
A probability distribution describes the set of probabilities for different outcomes in a random variable's sample space. It can be represented as graphs, tables, or formulas. This guide covers various types of distributions: discrete (like Binomial, Poisson, Negative Binomial) and continuous (like Normal, Log-normal, Exponential, Gamma). It highlights practical uses in statistics, such as calculating confidence intervals and hypothesis testing. Understanding probability distributions is essential for analyzing random processes and making informed decisions in fields like ecology, finance, and more.

Understanding Probability Distributions: Key Concepts and Applications
E N D
Presentation Transcript
What is a probability distribution? It is the set of probabilities on a sample space or set of outcomes
A random variable is a variable (typically represented by x) that has a single numerical value that is determined by chance. A probability distribution is a graph, table, or formula that gives the probability for each value of the random variable.
Practical Uses of Probability Distributions • To calculate confidence intervals for parameters. • Calculate critical regions for hypothesis tests. • How likely is a particular outcome?
Definitions • Discrete Distributions – The outcomes are a set of integers • Describe counting or sampling processes • Ranges that include some or all of the nonnegative integers • Continuous Distributions – A probability distribution over continuous range of values
Binomial • Each trial can only have one of two values • black/white, yes/no, alive/dead p =0.1 p =0.8 Probability p =0.5 # of successes
Poisson • Gives the distribution of the number of individuals, arrivals, events, counts, etc. in a given unit of counting effort • Use Poisson when the number counts could be limitless
Poisson • Number of seeds falling in a gap • number of offspring produced in a season • number of prey caught per unit time
Negative Binomial • Counts the number of failures before a predetermined number of success occurs • Good at describing a patchy or clumped distribution
Negative Binomial • Variance can be larger than the mean (overdispersed)
Geometric • The number of trials until you get a single failure (or the number of failures until you get a single success)
Continuous Distributions • Use probability density functions (pdf) • Normal • Lognormal • Exponential • Gamma
Probability density functions What’s the probability we had 2 inches of rainfall last night? ~20%
Probability density functions What’s the probability we had 2 inches of rainfall last night? Precision for continuous variables ! 0% chance of getting exactly 2 inches 0%
Probability density functions What is the probability that rainfall is between 1.98 and 2.25 inches? = 1.98< X < 2.25
Probability density functions = 1.98< X < 2.25 Area under the curve!
Probability density functions = 1.98< X < 2.25 Area under the curve! =1 100%
Normal Distribution All real values Add enough samples together and you get this bad boy =additive
Normal Distribution Example: Height of students
Log-normal Positive real values The product of many independent samples from same distribution =multiplicative
Log-normal example Population sizes in Deer
Gamma Positive real values The distribution of waiting times until a certain number of events take place
Gamma example α =1 Time till death of (α) crabs What is the probability that there will be one crab death under 200 days?
Exponential Positive real values The distribution of waiting times for a single event to happen
Exponential Example Oyster survival
Probability and Rules • To understand ecological models need to understand basic probability • Define: • All possible outcomes that could occur • Frequency that certain outcomes occur Probability of an even happening = # of ways it can happen/Total # of outcomes Sum of all the probabilities is always 1
Mutually Exclusive events • If event A happened then event B cannot happen at the same time A or B = Prob(A U B) Prob(A or B) = Prob(A) + Prob(B)
Joint Probability • Want to know the probability that two events will occur together at the same time • Probability bear will catch male fish larger than 30cm P (A or B) = P(A) + P(B) – P(A&B)
Independent events • Event A has no influence on event B • Multiply the probabilities to find the combined probability of a series of independent events Not independent
Conditional Probability • Events are not independent from each other (dependent) • The probability that event B will occur given that A has already occurred
Example of conditional • Infection status Infected Has lice Not Infected Does not have lice lice
Example • http://www.youtube.com/watch?v=mhlc7peGlGg
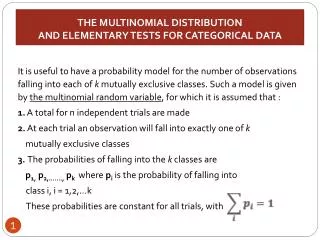
Example • The number of red mites counted on each of 150 apple leaves • Suppose that each mite had an equal probability of finding itself on a leaf, irrespective of the number of other mites present on a leaf • How would a random distribution of mites over the leaves appear?
Example • Burrow survey before and after cattle grazing • Recorded if a burrow entrance was open or collapsed • Compared the pre-grazing condition to the post grazing condition
Example • 300 male minks • Interested in growth rates between 5 different colors of mink • Brown color type is thought to have a very rapid growth rate What distribution would like fit the body weight of brown minks vs. time?
Example • Sage-grouse populations are estimated by attendance at leks • You survey males and females at all the leks in Idaho for one breeding season • What would you expect the distribution to look like?