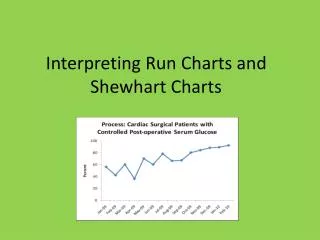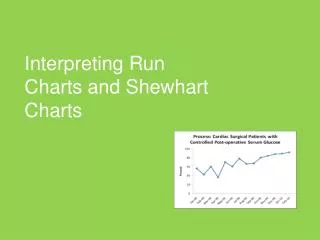
Utilizing Run Charts for Effective Progress Evaluation in Sustained Change
Run charts are an essential tool for improvement teams, providing a visual representation of data over time to assess the effectiveness of changes made in processes. They help teams formulate clearer aims, identify true improvements by showcasing patterns, and guide decision-making by highlighting the impact of specific changes. For more resources, visit the IHI Run Chart Tool and Tracker Tool. Leveraging run charts facilitates monitoring and fostering sustained improvement in various initiatives, ultimately leading to better outcomes over time.

Utilizing Run Charts for Effective Progress Evaluation in Sustained Change
E N D
Presentation Transcript
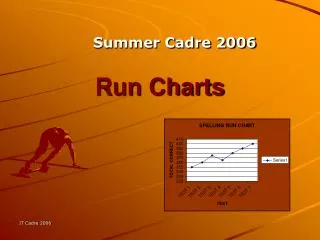
Using Run Charts to Evaluate Progress Lynne Hall EED Collaborative 7/2/12
Sustained Change OVER TIME = IMPROVEMENT Run charts • Graphs of data over time • Tool for assessing the effectiveness of change
RUN CHARTS Run charts have a variety of benefits: • Help improvement teams formulate aims by depicting how well (or poorly) a process is performing • Help in determining when changes are truly improvements by displaying a pattern of data that can observe as changes are made • Give direction to improvement with information about the value of particular changes
IHI RESOURCES RUN CHART TOOL • http://www.ihi.org/knowledge/Pages/Tools/RunChart.aspx TRACKER TOOL • http://app.ihi.org/Workspace/tracker/
Monitoring Improvement…RUN CHARTS Assessing Assessing