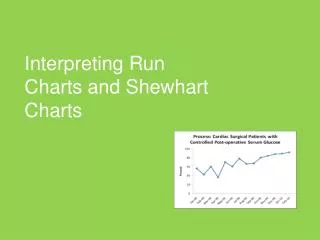
Run Charts
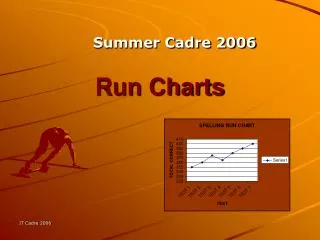
Run Charts. Summer Cadre 2006. What is a Run Chart?. A Run Chart is a way to have students or teachers graph progress over time toward a stated goal. Students and teachers receive measured feedback, which shows progress toward a stated goal.

Run Charts
E N D
Presentation Transcript
Run Charts Summer Cadre 2006
What is a Run Chart? • A Run Chart is a way to have students or teachers graph progress over time toward a stated goal. • Students and teachers receive measured feedback, which shows progress toward a stated goal. • The teacher will share the chart with the students to form a plan to increase student success. • Students can easily graph their own progress on any number of objectives.
Gathering Data • Step 1: Gather your data. • For example, the total number of correct answers by a class on a given series of spelling or math tests. Total the correct number of answers for your 20 students on a series of tests. 20 students x 20 items per test = 400 total possible answers. Test 1 - 350 answers correct Test 2 - 360 answers correct Test 3 - 375 answers correct Test 4 - 365 answers correct Test 5 - 385 answers correct Test 6 - 390 answers correct Test 7 - 400 answers correct
Enter the Data in a Spreadsheet • Open a new worksheet in Excel • Enter your data:
Making the Run Chart • Highlight the data ‘To highlight, Click cell A2 and then hold the left mouse button down as you drag the cursor down to last cell’ A2 Last Cell
Open the Chart Wizard • Click the Chart Wizard
Step 1 of the Chart Wizard • Click the type ‘Line’ and then ‘Next’
Step 2 of the Chart Wizard • Click ‘Next’
Step 3 of the Chart Wizard • Label your graph
Step 4 of the Chart Wizard • Click whether to have your chart be an object in your worksheet or a separate worksheet. • Click ‘Finish’
Moving the Chart on the Worksheet • Click on the chart and drag it to the new location
What is a Multiple-Line Run Chart? • Several subjects or groups may be tracked on a single chart, with each subject or group having its own line.
Gathering Data • Step 1: Gather your data. • For example, the total number of correct answers by a class on a given series of spelling or math tests. Column 2 - Total the correct answers for your 20 students on a series of tests. Column 3 – Individual results on a series of tests. Test 1 350 90 Test 2 360 85 Test 3 375 70 Test 4 365 90 Test 5 385 91 Test 6 390 94 Test 7 400 99
Enter the Data in a Spreadsheet • Open a new worksheet in Excel • Enter your data: • Remember to label your columns
Making the Run Chart • Highlight the data ‘To highlight, Click cell A1 and then hold the left mouse button down as you drag the cursor down to last cell’ A1 Last Cell
Open the Chart Wizard • Click the Chart Wizard
Step 1 of the Chart Wizard • Click the type ‘Line’ and then ‘Next’
Step 2 of the Chart Wizard • Click ‘Next’
Step 3 of the Chart Wizard • Label your graph • Click Next
Step 4 of the Chart Wizard • Click whether to have your chart be an object in your worksheet or a separate worksheet. • Click ‘Finish’
Moving the Chart on the Worksheet • Click on the chart and drag it to the new location