Download
1 / 7
70 likes | 215 Vues
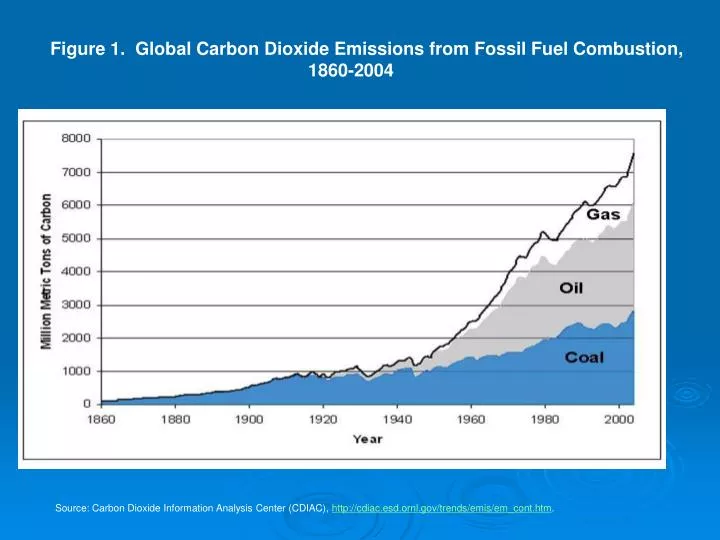
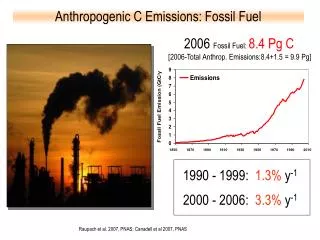
Figure 1. Global Carbon Dioxide Emissions from Fossil Fuel Combustion, 1860-2004. Source: Carbon Dioxide Information Analysis Center (CDIAC), http://cdiac.esd.ornl.gov/trends/emis/em_cont.htm. World Carbon Dioxide Emissions, Historical and Projected.

E N D
Figure 1. Global Carbon Dioxide Emissions from Fossil Fuel Combustion, 1860-2004 Source: Carbon Dioxide Information Analysis Center (CDIAC), http://cdiac.esd.ornl.gov/trends/emis/em_cont.htm.
FIGURE 2: CARBON STABILIZATION SCENARIOS (450 and 550 ppm) Source: Adapted from IPCC, Climate Change 2001: The Scientific Basis, http://www.ipcc.ch/
Figure 6. The Relationship between the Level of Greenhouse Gas Stabilization and Eventual Temperature Change Source: Stern, 2007.
Figure 8. Gasoline Price versus Use in Industrial Countries, 2003 Note: Shaded area represents price/consumption range typical of West European countries. Source: U.S. Department of Energy, 2004. Adapted from Roodman, 1997, with updated data.
Figure 11. Historical and Projected U.S. Greenhouse Gas Emissions Sources: Historical emissions from the U.S. Inventory of Greenhouse Gas Emissions and Sinks, U.S. Environmental Protection Agency. Projected emissions from Fourth Climate Action Report to the UN Framework Convention on Climate Change, U.S. Department of State, 2007.
POLICY FOR CLIMATE STABILZATION • Carbon tax or equivalent (cap & trade) – must be ≥ $100/MT C ($30/MT C02) and rise over time • Recycle revenues of ≥ $150 billion for energy efficiency, renewables, progressive rebates • R&D investment ($3-12 billion) • Infrastructure investment – hi-speed rail, public transit, green buildings • Preferential credit for energy efficiency investments

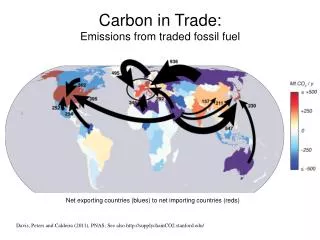


![Human carbon dioxide emissions [ Mt C]](https://cdn3.slideserve.com/5454257/slide1-dt.jpg)