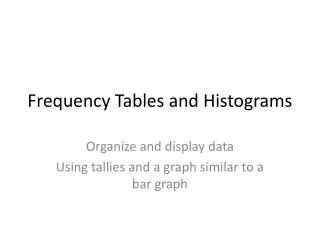
Exploring Frequency Tables for Data Analysis
Learn how to create, interpret, and analyze frequency tables for discrete and continuous data using examples from surveys and race times. Understand mean calculation, class intervals, two-way tables, relative frequencies, and data grouping. Discover the importance of accurate data representation in statistical analysis.

Exploring Frequency Tables for Data Analysis
E N D
Presentation Transcript
Survey results Jamilia carries out a survey to find out how many sports the students in her school do. She lists the responses in her notepad. It is not easy to see patterns or trends in the data. How could Jamilia use a table to make the results easier to read?
Discrete data in frequency tables Jamilia decides to write all the possible results in one column of a table and record how often they occur. This is called a frequency table. number of sports played frequency 0 20 1 17 2 15 3 10 4 9 5 3 Use the list to fill in the frequency table for Jamilia. 6 2
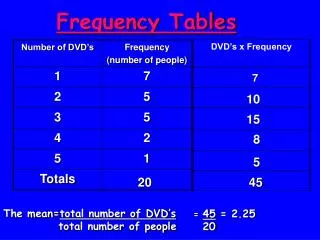
Calculating the mean How can you find the mean number of sports? ∑(data value × frequency) Total frequency Multiply each data value by its frequency. number of sports × frequency numbers of sports played frequency 0 20 0 × 20 = 0 Add these values together. 1 17 1 × 17 = 17 2 15 2 × 15 = 30 3 10 3 × 10 = 30 Divide the sum by the total frequency. 4 9 4 × 9 = 36 5 3 5 × 3 = 15 6 2 6 × 2 = 12 140 76 mean = TOTAL 76 140 = 2 sports
88.491.592.193.393.994.795.0 95.395.5 95.695.696.396.596.997.097.097.097.3 97.497.497.797.898.098.298.298.498.4 98.598.999.099.199.699.699.8100.0 100.6 100.6101.1101.4101.4101.5101.6101.6101.8101.9 102.1102.5102.6102.7103.1103.1103.1104.1105.0 105.2105.6105.6105.7105.8105.9 Continuous data Here are the race times in seconds from a downhill race event. Putting these into a frequency table as they are will not be helpful. Instead we can group the times into intervals.
Times in seconds Frequency 85 – 90 90 – 95 95 – 100 100 – 105 105 – 110 Notation for class intervals Louise decides to create her own groups and draws a table with class intervals that she thinks fit the race data. What is wrong with this table? How should the class intervals be written down? How can your knowledge of inequalities help you to create better class intervals?
88.491.592.193.393.994.795.0 95.395.5 95.695.696.396.596.997.097.097.097.3 97.497.497.797.898.098.298.298.498.4 98.598.999.099.199.699.699.8100.0 100.6 100.6101.1101.4101.4101.5101.6101.6101.8101.9 102.1102.5102.6102.7103.1103.1103.1104.1105.0 105.2105.6105.6105.7105.8105.9 Intervals Use the original data from the race to complete the frequency table to show the number of times in each interval. 1 5 28 19 7
Two-way frequency tables Two-way frequency tables are used to examine the relationship between two categories or groups. For example, Rosa asked two hundred people what type of drink they had in a local coffee house. She recorded the results in this two-way frequency table. special hot drink special cold drink regular coffee total women 10 58 42 110 men 56 10 24 90 total 66 68 66 200 What two categories is Rosa comparing in the table?
Joint and marginal frequencies special hot drink special cold drink regular coffee total women 10 58 42 110 men 56 10 24 90 total 66 68 66 200 The numbers in the body of the table, shown in pink, are called joint frequencies. The totals, shown in blue, are called marginal frequencies. What trends do you notice from the table? List as many as you can and justify each one.
Relative frequencies To convert a two-way frequency table to a relative frequency tabledivide each cell in the table by the number of participants. special hot drink special cold drink regular coffee total 10 58 42 110 = 0.55 = 0.05 = 0.29 = 0.21 women 200 200 200 200 56 10 24 90 = 0.05 = 0.45 = 0.12 = 0.28 men 200 200 200 200 66 68 66 200 = 0.33 = 0.34 = 1 total = 0.33 200 200 200 200 What does the number 0.12 in the table signify?
Rows and columns Depending on what we want to analyze we can also create relative frequencies for columnsandrelative frequencies for rows. for columns for rows regular coffee special hot drink special cold drink total regular coffee special hot drink special cold drink total women 0.09 0.53 0.38 1.00 women 0.15 0.85 0.64 0.55 men 0.62 0.11 0.27 1.00 men 0.85 0.15 0.36 0.45 total 0.33 0.34 0.33 1.00 total 1.00 1.00 1.00 1.00 Every number is divided by the total for that row in the original table. Every number is divided by the total for that column in the original table.