Frequency Tables
Frequency Tables. Yashira Rivera. Stem-and-Leaf-Plot. A stem-and-leaf plot is a display that organizes data to show its shape and distribution.


Frequency Tables
E N D
Presentation Transcript
Frequency Tables Yashira Rivera
Stem-and-Leaf-Plot • A stem-and-leaf plot is a display that organizes data to show its shape and distribution. • In a stem-and-leaf plot each data value is split into a "stem" and a "leaf". The "leaf" is usually the last digit of the number and the other digits to the left of the "leaf" form the "stem". The number 123 would be split as: • stem 12 • leaf 3
The data: Math test scores out of 60 points: 35, 36, 38, 40, 42, 42, 44, 45, 45, 47, 48, 49, 50, 50, 50, 55, 57, 60, 60. Math Test Scores (out of 50 pts.) Stem-and-Leaf-Plot
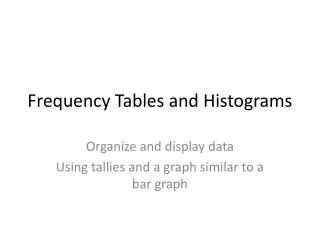
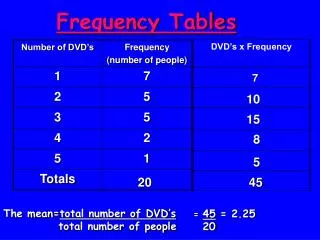
Frequency Tables • The frequency of a particular data value is the number of times the data value occurs. • For example, if four students have a score of 80 in mathematics, and then the score of 80 is said to have a frequency of 4. • A frequency table is constructed by arranging collected data values in ascending order of magnitude with their corresponding frequencies.
How to make a Frequency Table? Math Test Scores (out of 50 pts.) • Titles • Data
The data: Math test scores out of 60 points: 35, 36, 38, 40, 42, 42, 44, 45, 45, 47, 48, 49, 50, 50, 50, 55, 57, 60, 60. Create a Frequency Table. Math Test Scores (out of 50 pts.)
Frequency Table Math Test Scores (out of 50 pts.)
Frequency Tables Why did you plan to attend Barry University? Close to Home-18 South Fl Area-37 Scholarships-23 Major-16 Friends-6