Frequency tables and Line Plots
Frequency tables and Line Plots. Homework. I will be able to understand tally charts(frequency table). I will be able to draw line plots. Warm up. Coordinate plane Four Quadrants Equation of Line. T chart Drawing the line using the equations. Continuation of yesterday problems.


Frequency tables and Line Plots
E N D
Presentation Transcript
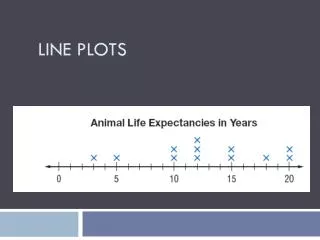
Frequency tables and Line Plots • Homework • I will be able to understand tally charts(frequency table). • I will be able to draw line plots
Warm up • Coordinate plane • Four Quadrants • Equation of Line • T chart • Drawing the line using the equations
What is data? • Data is statistics usually numbers that are connected with real life situations. If we were going to count how many people came to an amusement park in one day, the number of people that we counted would be the data.
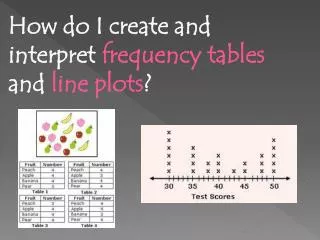
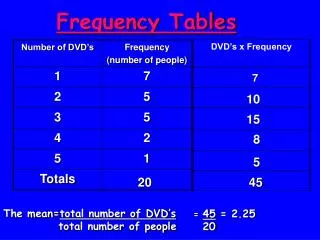
Frequency Table • One way of organizing data is to use a frequency table. A frequency table is a table that shows how often something occurs. First, we count or keep track of information, then we take that information and put it into a table with different columns.
Example • Jeff counted the number of ducks he saw swimming in the pond each morning on his way to school. Here are his results. • 6, 8, 12, 14, 5, 6, 7, 8, 12, 11, 12, 5, 6, 6, 8, 11, 8, 7, 6, 13 • Organize the data and draw the line plot • Find the mean , median, mode , range of the data
Mean, median, mode, range • Explain in your own words.