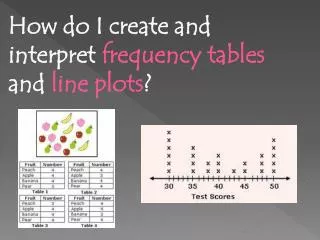
Exploring Data: Line Plots and Frequency Tables
110 likes | 213 Vues
Learn how to create frequency tables and line plots to visualize data values using examples and vocabulary. Practice making tables for fingerprint patterns, tennis balls, aluminum cans, and more.

Exploring Data: Line Plots and Frequency Tables
E N D
Presentation Transcript
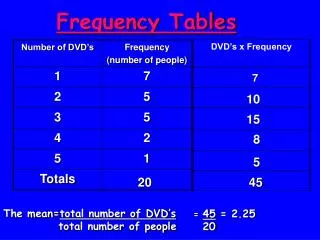
VOCABULARY The frequency of a data value is the number of times it occurs. A frequency table tells the number of times an event, category, or group occurs.
whorl loop whorl loop arch arch loop whorl loop arch whorl arch arch whorl arch loop Example 1: Using Tally Marks to Make a Frequency Table Students in Mr. Ray’s class recorded their fingerprint patterns. Which type of pattern do most students in Mr. Ray’s class have? Make a table to show each type of fingerprint.
Reading Math A group of four tally marks with a line through it means five. t llll = 5 llll llll = 10
whorl loop whorl loop arch whorl loop whorl loop whorl whorl arch arch whorl arch loop Example 1 Students in Ms. Gracie’s class recorded their fingerprint patterns. Which type of pattern do more students in Ms. Gracie’s class have? Make a table to show each type of fingerprint.
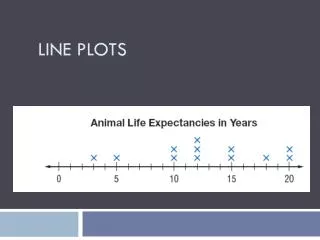
VOCABULARY A line plot uses a number line and x’s or other symbols to show frequencies of values.
Tennis Balls Collected 10 14 11 16 11 10 14 10 15 15 10 11 Example 2: Making a Line Plot Students collected tennis balls for a project. The number of balls collected by the students is recorded in the table. Make a line plot of the data.
Cans Collected 5 7 11 14 11 5 7 14 14 5 15 11 Example 3 Students collected aluminum cans for a project. The number of cans collected by the students is recorded in the table. Make a line plot of the data.
Pages Read Last Weekend 12 15 40 19 7 5 22 34 37 18 Example 4: Making a Frequency Table with Intervals Use the data in the table to make a frequency table with intervals.
Number of Miles Driven on Saturday 17 29 9 19 7 5 27 34 21 38 Example 5 Use the data in the table to make a frequency table with intervals.