Line Plots
Line Plots. Unit of Study: 9 Global Concept Guide: 1 of 4. Content Development.


Line Plots
E N D
Presentation Transcript
Line Plots Unit of Study: 9 Global Concept Guide: 1 of 4
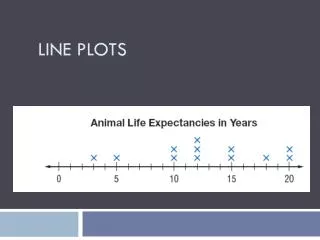
Content Development • “Line plots are counts of things along a numeric scale. To make a line plot, a number line is drawn and an X is made above the corresponding value on the line for every corresponding data element. One advantage of a line plot is that every piece of data is shown on the graph. It is also a very easy type of graph for students to make . It is essentially a bar graph with a potential bar for every possible value.” (Van De Walle, 2010) Students have measured different amounts of water into beakers for an experiment. • Use data collected in line plots to perform operations (Ex. If the liquids above were redistributed, how much liquid would be in each beaker? What is the total amount of liquid in all of the beakers?) Liquid in Beakers Liquid Used (in cups)
Day 1 Students are asked to find the average using the data from the line plot. There are several types of averages, or measures of central tendencies: mean, median, and mode. Typically when people used the term average, they are referring to the mean, students find the sum of all the values and divide by the number of items in the data set. Line plots will help students represent and visualize data. (Go Math TE pg. 369A) Essential Question: How can a line plot help find an average with data given in fractions? *Note- standard specifies only (, . Order of Operations can be helpful when students are working through multiple steps with these problems. For an example of using a line plot to represent fractional amounts click on the picture. • By the end of day 1, students should be able to determine the average (mean) of a set of data using a line plot that contains fractional increments.
Day 2 Click on the link for a blank line plot. Essential Question: How can real world scenarios be solved using line plots? • Students can collect fraction data to make a line plot. The activity below allows students to investigate fractional amounts found in recipes. (Go Math TE pg. 371) Measurements give students the opportunity to create line plots with fractional increments, and add and subtract the fractional amounts at each increment in order to solve real world situations. • Suggestion: Students can work in small groups to reinforce and apply content learned from day 1. Click on the link for pumpkin pie recipes • By the end of day 2, students should be able to create a line plot with fractional amounts and use it analyze and compare data.
Enrich/Reteach/Intervention • Reteach- Go Math RtI Tier 2 TE 369B- Students label a number line and represent data with snap cubes. • Core- Go Math Enrich TE 369B- Students create a line plot using their own list of data. • Enrich-Illustrative Mathematics – Students work in pairs to add and plot fractions on a line plot. Click on link.
Literature Connection Teachers can use Inch Worm and a Half to collect measurements that were made and track the numbers of each measured item from the pictures in a line plot.