Organization of Data Frequency Tables
50 likes | 266 Vues
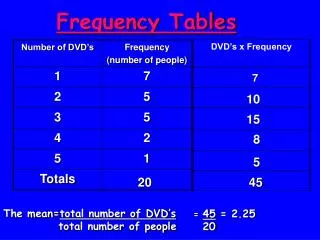
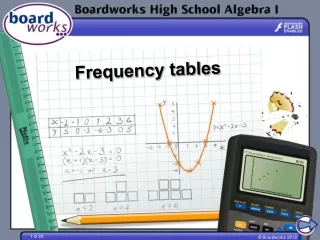
Organization of Data Frequency Tables. 2.2. Frequency Table. Keeps track of the number of times an outcome occurs. Ordering the data first makes a frequency table easier Tally marks can be used. Create a Frequency Table for the given Data. Test Scores

Organization of Data Frequency Tables
E N D
Presentation Transcript
Frequency Table • Keeps track of the number of times an outcome occurs. • Ordering the data first makes a frequency table easier • Tally marks can be used
Create a Frequency Table for the given Data • Test Scores • 82 75 55 98 84 76 57 • 75 92 98 82 82 55 98 • 75 98 55 74 66 57 98
Frequency Tables with classes • A Frequency Table where the values fall into classes. • Lower class limit – the smallest number in a class. • Upper class limit – The largest number is a class. • Class width- The size of the class. • Class midpoint – The midpoint of the class. (upper + lower)/2 • Relative Frequency – Expressed as a percent.
Create a Frequency Table using classes. • Test Scores • 82 75 55 98 84 76 57 • 75 92 98 82 82 55 98 • 75 98 55 74 66 57 98