Investigating BTG2 Effects on Cell Signaling Pathways in IMR90 and A549 Cell Lines
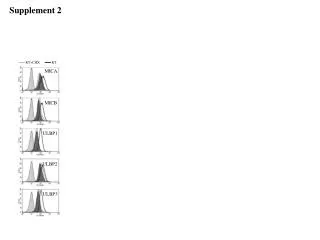
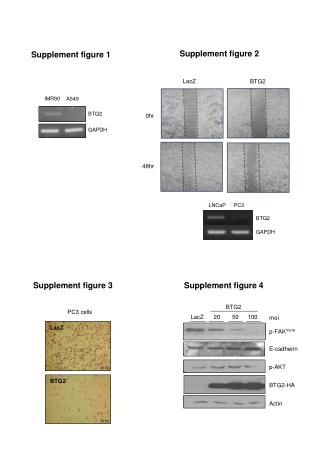
This study explores the role of BTG2 in modulating various cellular signaling pathways in IMR90 and A549 cell lines. Supplementary figures provide detailed assessments of p-FAK phosphorylation, E-cadherin expression, and apoptotic markers. The analysis includes comparisons between LacZ controls and BTG2 variants at different multiplicities of infection (MOI), revealing significant alterations in Akt activation and ROS levels. These findings contribute to our understanding of BTG2's functional roles in cancer biology, particularly in how it influences cell survival and signaling.

Investigating BTG2 Effects on Cell Signaling Pathways in IMR90 and A549 Cell Lines
E N D
Presentation Transcript
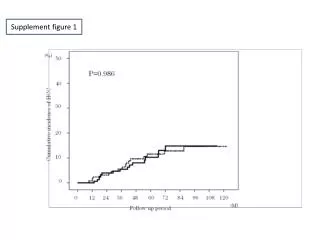
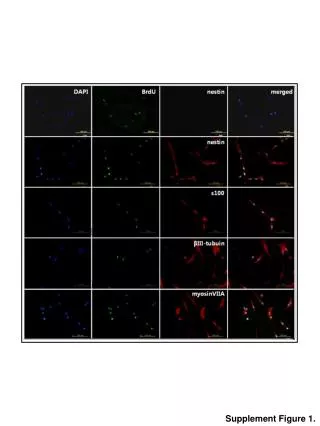
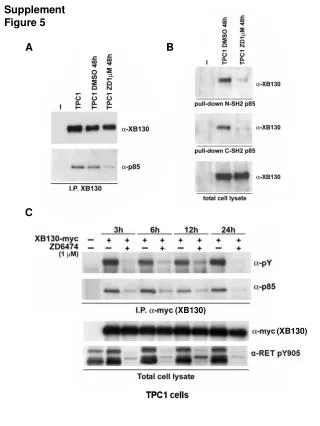
Supplement figure 1 BTG2 LacZ 20 50 100 moi IMR90 A549 p-FAKY576 BTG2 E-cadherin GAPDH p-AKT BTG2-HA Actin Supplement figure 2 LacZ BTG2 0hr 48hr LNCaP PC3 BTG2 GAPDH Supplement figure 3 Supplement figure 4 PC3 cells LacZ X100 BTG2 X100
LacZ 100 50 0 moi BTG2 0 50 100 moi p-FAKY397 100 p-FAKY576 100 p-FAKY925 100 FAK 100 20 BTG2-HA Supplement figure 6 Supplement figure 5 LacZ 80 moi 1.2 1.0 * 0.8 ROS/DCF-DA fluorescence (Fold induction) 0.6 0.4 BTG2 80 moi 0.2 0 BTG2 LacZ : p<0.01 vs. LacZ * Supplement figure 7 Supplement figure 8 Huh7 cells Mitochondria Nucleus Cytosol 1.2 1.0 Lamin B1 70 * * 0.8 OxPhos Complex II ROS/DCF-DA fluorescence (Fold induction) 70 0.6 70 0.4 a-tubulin 50 0.2 20 BTG2-HA 0 LacZ Wt-BTG2 MT-BTG2 * : p<0.01 vs. LacZ