
Uploaded by
amergin-hone
1 SLIDES
131 VUES
10LIKES
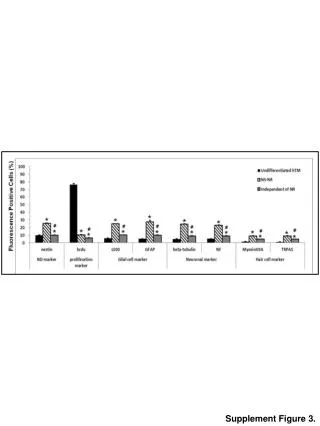
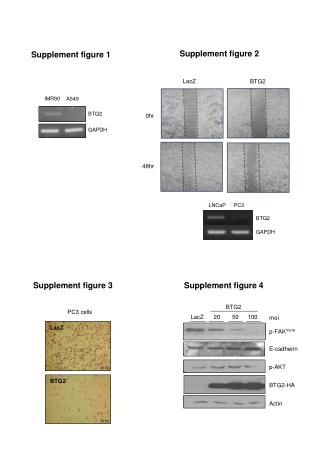
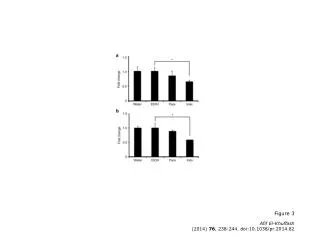
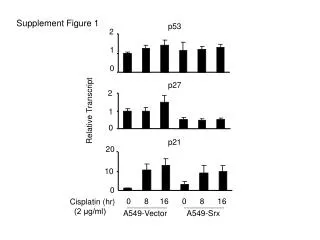
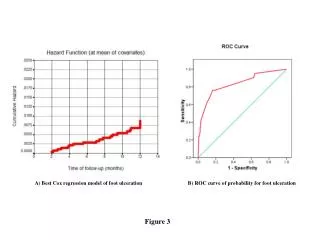
Analysis of Experimental Results in Supplement Figure 3
DESCRIPTION
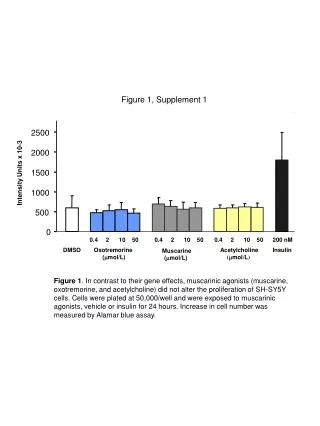
Supplement Figure 3 presents a detailed examination of the experimental data collected during our study. It visually conveys the key findings, including the trends and statistical significance of the results. The figure includes various datasets that support our hypothesis and illustrates the impact of different variables on the outcomes. Readers are encouraged to interpret the figure alongside the corresponding text in the main document for better context and understanding of the experimental methodology and results.
Download
1 / 1
Télécharger la présentation 
Analysis of Experimental Results in Supplement Figure 3
An Image/Link below is provided (as is) to download presentation
Download Policy: Content on the Website is provided to you AS IS for your information and personal use and may not be sold / licensed / shared on other websites without getting consent from its author.
Content is provided to you AS IS for your information and personal use only.
Download presentation by click this link.
While downloading, if for some reason you are not able to download a presentation, the publisher may have deleted the file from their server.
During download, if you can't get a presentation, the file might be deleted by the publisher.
E N D


More Related
Audio
Live Player