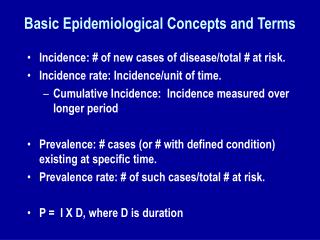
Laboratory Medicine: Basic QC Concepts
Laboratory Medicine: Basic QC Concepts. M. Desmond Burke, MD . Laboratory Error, “Normal Ranges,” & Predictive Values. M. Desmond Burke, M.D. Weill Cornell Medical Center New York, New York . Laboratory Diagnosis. laboratory error - preanalytical - analytical: accuracy & precision

Laboratory Medicine: Basic QC Concepts
E N D
Presentation Transcript
Laboratory Medicine: Basic QC Concepts M. Desmond Burke, MD
Laboratory Error, “Normal Ranges,” & Predictive Values M. Desmond Burke, M.D. Weill Cornell Medical Center New York, New York
Laboratory Diagnosis • laboratory error - preanalytical - analytical: accuracy & precision • “normal” or “reference” values • sensitivity, specificity & prevalence • predictive value • pretest & posttest probabilities • thresholds & test strategy
CLINICALCLUES TEST STRATEGIES HYPOTHESIS ACTIVATION HYPOTHESIS REVISION ROUTINE TESTS PATIENT MANAGEMENT
CLINICAL VALUE DIAGNOSTIC VALUE TECHNICAL RELIABILITY
Action Test selection Interpretation Question Reporting Ordering Analysis Identification Preparation Collection Transportation
Laboratory Error: Preanalytical • patient preparation - diet, activity • specimen collection - wrong name, wrong tube, wrong time wrong technique • specimen transport & storage - delays, wrong temperature
Accuracy & Precision • Accuracy: “closeness to truth” - maintained routinely by calibrators - checked by inter-laboratory surveys • Precision: “ reproducibility” - estimated by Standard Deviation (SD) or Coefficient of Variation (CV) - monitored by quality control sera
Precise& Inaccurate Inaccurate & Imprecise Precise & Accurate o o o o o o o oo o o o o o o o Accurate & Imprecise
Importance of Quality Control to the Physician • QUESTION:when is the difference between two successive test results within the limits of analytical imprecision? • ANSWER:when the results differ by more than 3 x SD of the laboratory method
“Normal” or “Reference” • “reference”is the appropriate word - central 95 percent of the range of values in an apparently healthy population • “normal” could mean: - free of neurosis, usual, ideal, free of disease, or including the central 95 percent of a “normal” or gaussian distribution
95% 68% # Mg/dL
Relationship of “Expected Abnormal Results” to Number of Measured Constituents Probability of abnormal result: 1 – 0.95n : n equals test number
CLINICAL VALUE DIAGNOSTIC VALUE TECHNICAL RELIABILITY
POST-TEST PROBABILITIES POST-TEST PROBABILITY, GIVEN A POSITIVE TEST RESULT = PV+ POST-TEST PROBABILITY, GIVEN A NEGATIVE TEST RESULT = 100 – PV-
TEST TREAT DO NOT TEST DO NOT TEST DO NOT TREAT 1.0 0.0 RULE-IN THRESHOLD RULE-OUT THRESHOLD PROBABILITY OF DISEASE
POSTTEST NEG (P) PRETEST (P) POSTTEST POS (P) 10 50 90 TEST 1.0 0.0 RULE-IN THRESHOLD RULE-OUT THRESHOLD PROBABILITY OF DISEASE
Sensitivity & Specificity • SENSITIVITY - the percentage of diseased individuals with abnormal test results • SPECIFICITY - the percentage of healthy individuals with normal results
False Negatives & False Positives • FALSE NEGATIVE RATE - 100 minus SENSITIVITY • FALSE POSITIVE ATE - 100 minus SPECIFICITY
Predictive Values • POSITIVE PREDICTIVE VALUE (PV+) - the percentage of true positive test results among all positive test results • NEGATIVE PREDICTIVE VALUE (PV-) - the percentage of true negative test results among all negative test results
TEST RESULT DISEASE PRESENT DISEASE ABSENT POSITIVE TP FP POSTTEST PROBABILITY GIVEN A POSITIVE RESULT: TP/TP+FP NEGATIVE FN TN POSTTEST PROBABILITY GIVEN A NEGATIVE RESULT: FN/TN+FN TOTALS TP + FN TN + FP SENSITIVITY TP/TP+FN SPECIFICITY TN/FP+TN
POSTTEST PROBABILITY OF DISEASE WHEN PRETEST PROBABILITY IS 50% TEST RESULT DISEASE PRESENT DISEASE ABSENT POSITIVE 90 10 POSTTEST PROBABILITY GIVEN A POSITIVE RESULT: 90/100 (90%) NEGATIVE 10 90 POSTTEST PROBABILITY GIVEN A NEGATIVE RESULT: 10/100 (10%) TOTALS 100 100 SENSITIVITY 90% SPECIFICITY 90%
POSTTEST NEG (P) PRETEST (P) POSTTEST POS (P) 10 50 90 TEST 1.0 0.0 RULE-IN THRESHOLD RULE-OUT THRESHOLD PROBABILITY OF DISEASE
POSTTEST PROBABILITY OF DISEASE WHEN PRETEST PROBABILITY IS 90% TEST RESULT DISEASE PRESENT DISEASE ABSENT POSITIVE 810 10 POSTTEST PROBABILITY GIVEN A POSITIVE RESULT: 810/820 (99%) NEGATIVE 90 90 POSTTEST PROBABILITY GIVEN A NEGATIVE RESULT: 90/180 (50%) TOTALS 900 100 SENSITIVITY 90% SPECIFICITY 90%
POSTTEST PROBABILITY OF DISEASE WHEN PRETEST PROBABILITY IS 10% TEST RESULT DISEASE PRESENT DISEASE ABSENT POSITIVE 90 90 POSTTEST PROBABILITY GIVEN A POSITIVE RESULT: 90/180 (50%) NEGATIVE 10 810 POSTTEST PROBABILITY GIVEN A NEGATIVE RESULT: 10/820 (1%) TOTALS 100 900 SENSITIVITY 90% SPECIFICITY 90%
Effects of Prevalence • DECREASING PREVALENCE - decreases (PV+) & increases (PV-) • INCREASING PREVALENCE - increases (PV+) & decreases (PV-)
F D D X Xc
5 10 12 15 D D X Xc
RECEIVER-OPERATOR CHARACTERISTIC (ROC) CURVES 100 BEST BETTER % TP 50 USELESS 100 0 50 % FP
DETERMINANTS OF SENSITIVITY - choice of cutoff or reference limit - severity of disease in patients chosen to determine sensitivity - increased by multiple testing in parallel • DETERMINANTS OF SPECIFICITY - choice of cutoff or reference limit - type of nondiseased persons chosen to determine specificity - increased by multiple testing in series
WHICH TEST TO ORDER? WHAT IS THE PRETEST PROBABILITY OF THE PROBLEM? WHAT ARE THE “RULE IN” & “RULE OUT” THRESHOLDS TO RULE IN TO RULE OUT KEY IS: SPECIFICITY KEY IS: SENSITIVITY POSTTEST PROBABILITY (+) SHOULD BE HIGHER THAN “RULE IN” THRESHOLD POSTEST PROBABILITY (-) SHOULD BE LOWER THAN THE “RULE OUT” THRESHOLD
POSTTEST PROBABILITY OF CHD WHEN PRETEST PROBABILITY IS 10% TEST RESULT DISEASE PRESENT DISEASE ABSENT POSITIVE 86 207 POSTTEST PROBABILITY GIVEN A POSITIVE RESULT: 86/293 (29%) NEGATIVE 14 693 POSTTEST PROBABILITY GIVEN A NEGATIVE RESULT: 14/707 (2%) TOTALS 100 900 SENSITIVITY 86% SPECIFICITY 77%
POSTTEST PROBABILITY OF CHD WHEN PRETEST PROBABILITY IS 90% TEST RESULT DISEASE PRESENT DISEASE ABSENT POSITIVE 774 23 POSTTEST PROBABILITY GIVEN A POSITIVE RESULT: 774/797 (97%) NEGATIVE 126 77 POSTTEST PROBABILITY GIVEN A NEGATIVE RESULT: 126/203 (62%) TOTALS 900 100 SENSITIVITY 86% SPECIFICITY 77%
POSTTEST NEG (P) PRETEST (P) POSTTEST POS (P) 90 62 97 TEST 1.0 0.0 RULE-IN THRESHOLD RULE-OUT THRESHOLD PROBABILITY OF DISEASE
POSTTEST NEG (P) PRETEST (P) POSTTEST POS (P) 1 10 50 TEST 1.0 0.0 RULE-IN THRESHOLD RULE-OUT THRESHOLD PROBABILITY OF DISEASE