
Uploaded by
wind
1 SLIDES
164 VUES
10LIKES
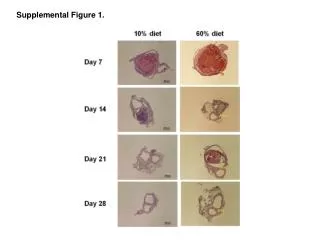
Supplemental Figure 1.
DESCRIPTION
Supplemental Figure 1.
Download
1 / 1
Download Presentation

Télécharger la présentation
Supplemental Figure 1.
An Image/Link below is provided (as is) to download presentation
Download Policy: Content on the Website is provided to you AS IS for your information and personal use and may not be sold / licensed / shared on other websites without getting consent from its author.
Content is provided to you AS IS for your information and personal use only.
Download presentation by click this link.
While downloading, if for some reason you are not able to download a presentation, the publisher may have deleted the file from their server.
During download, if you can't get a presentation, the file might be deleted by the publisher.
E N D


More Related
Audio
Live Player