Download
1 / 43
430 likes | 446 Vues
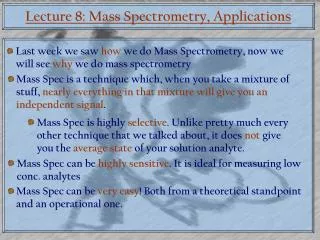
Learn the fundamentals of mass spectrometry and how to acquire mass spectra. Understand ionization, mass sorting and detection techniques. Explore different types of mass analyzers and their applications in proteomics research.

E N D
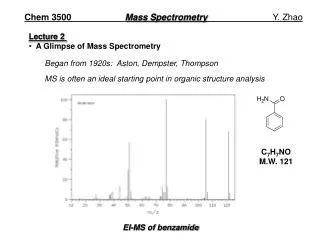
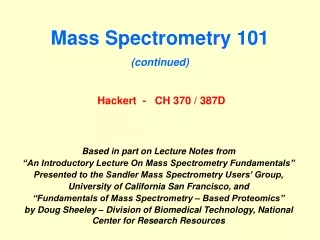
Mass Spectrometry 101 (continued) Hackert - CH 370 / 387D Based in part on Lecture Notes from “An Introductory Lecture On Mass Spectrometry Fundamentals” Presented to the Sandler Mass Spectrometry Users’ Group, University of California San Francisco, and “Fundamentals of Mass Spectrometry – Based Proteomics” by Doug Sheeley – Division of Biomedical Technology, National Center for Research Resources
Summary: acquiring a mass spectrum Ionization Mass Sorting (filtering) Detection Ion Source Ion Detector Mass Analyzer • Form ions • (charged molecules) Sort Ions by Mass (m/z) • Detect ions Quadrupole Time of flight (TOF) Ion Trap Magnetic Sector FTMS Microchannel Plate Electron Multiplier Hybrid / photomultiplier Inlet • Solid • Liquid • Vapor 100 75 50 MALDI ESI FAB EI CI 25 0 1330 1340 1350 Mass Spectrum
Mass Spectrometry • Introductory Example: mass spectrum of water • Electron Impact (EI) - Hard (fragments) /1000 Da • H2O + fast electron [H2O]+ + 2 electrons • + fragments ([OH]+, O+, H+) Fragmentation pattern [H2O]+ 18 [OH]+ 17 O+ 16 H+ 1 Molecular Ion (“fingerprint”) Relative Abundance 1 16 17 18 Mass-to-charge ratio
Resolution =18100 8000 6000 Resolution = 14200 Counts 4000 Resolution = 4500 2000 0 2840 2845 2850 2855 Mass (m/z) Mass measurement accuracy depends on resolution High resolution means better mass accuracy 15 ppm error 24 ppm error 55 ppm error
Mass spectrum of insulin 2 x 13C 13C 12C: 5730.61 Insulin has 257 C-atoms. Above this mass, the monoisotopic peak is too small to be very useful, and the average mass is usually used.
ESI Spectrum of Trypsinogen (MW 23,983) M + 15 H+ 1599.8 M + 16 H+ M + 14 H+ 1499.9 1714.1 M + 13 H+ 1845.9 1411.9 1999.6 2181.6 m/z Mass-to-charge ratio
MALDI(Matrix Assisted Laser Desorption Ionization) “Nuke It”
Summary: acquiring a mass spectrum Ionization Mass Sorting (filtering) Detection Ion Source Ion Detector Mass Analyzer • Form ions • (charged molecules) Sort Ions by Mass (m/z) • Detect ions Quadrupole Time of flight (TOF) Ion Trap Magnetic Sector FTMS Microchannel Plate Electron Multiplier Hybrid / photomultiplier Inlet • Solid • Liquid • Vapor 100 75 50 MALDI ESI FAB EI CI 25 0 1330 1340 1350 Mass Spectrum
Mass analyzers separate ions based on their mass-to-charge ratio (m/z) • Operate under high vacuum (keeps ions from bumping into gas molecules) • Actually measure mass-to-charge ratio of ions (m/z) • Key specifications are resolution, mass measurement accuracy, and sensitivity. • Several kinds exist: for bioanalysis, quadrupole,time-of-flight and ion traps are most used.
Quadrupole Mass Analyzer Uses a combination of RF and DC voltages to operate as a mass filter. • Has four parallel metal rods. • Lets one mass pass through at a time. • Can scan through all masses or sit at one fixed mass.
m1 m2 m4 m3 m2 m1 m4 m3 mass scanning mode m1 m2 m2 m2 m2 m2 m4 m3 single mass transmission mode Quadrupoles have variable ion transmission modes
Time-of-flight (TOF) Mass Analyzer Source Drift region (flight tube) + + detector + + V • Ions are formed in pulses. • The drift region is field free. • Measures the time for ions to reach the detector. • Small ions reach the detector before large ones.
40000 30000 20000 10000 0 The mass spectrum shows the results MALDI TOF spectrum of IgG MH+ Relative Abundance (M+2H)2+ (M+3H)3+ 50000 100000 150000 200000 Mass (m/z)
What is MSMS? MS/MS means using two mass analyzers (combined in one instrument) to select an analyte (ion) from a mixture, then generate fragments from it to give structural information. Mixture of ions Single ion Fragments Ion source MS-1 MS-2
Cleavages Observed in MS/MS of Peptides yn-i xn-i ai bi low energy high energy zn-i vn-i wn-i -HN--CH--CO--NH--CH--CO--NH- Ri CH-R’ R” ci di+1 CID (Collision InDuced) Spectra – adds sequence data to mass mapping for improved database identification!
E=Glu G=Gly S=Ser F=Phe N=Asn P=Pro V=Val A=Ala R=Arg Peptide Fragmentation => E G S F F G E E N P N V A R 175.10 246.14 345.21 459.25 556.30 670.35 799.39 928.43 985.45 1132.52 1279.59 1366.62 1423.64 1552.69 = = =
Interpretation of an MSMS spectrum to derive structural information is analogous to solving a puzzle + + + + + Use the fragment ion masses as specific pieces of the puzzle to help piece the intact molecule back together
Mass Spec Applications in Proteomics and Systems Biology CH370 - Hackert
Genomics Proteomics Interactomics Systems Biology – None of these fields of research would be possible without Bioinformatics, which would not be possible with lots of computing power!
Note: HT Proteomics is restricted to those species where a sequence database exists!
With the new genomic data bases of model species, such as Esherichia coli, Saccharomyces cerevisae, mouse, and human, the sequences of many/most proteins of biological interest will in principle be known, and the problem of characterizing a protein primary structure will be reduced to identifying it in the data base. Within the past few years research groups have demonstrated how MS can be used for identification of proteins in sequence data bases. One approach is to cleave the protein with a sequence-specific proteolytic enzyme, measure molecular weight values for the resulting peptide mixture by mass spectrometry, and search a sequence data base for proteins that should yield these values. Search algorithms can utilize low resolution tandem mass spectra of selected peptides (<3 kDa) from the protein degradation. Yates and coworkers compared the MS/MS sequence data to the sequences predicted for each of the peptides that would be generated from each protein in the data base. In the PEPTIDESEARCH sequence tag approach of Mann and Wilm, a partial sequence of 2–3 amino acids is assigned from the fragment mass differences in the MS/MS spectrum. This partial sequence and its mass distance from each end of the peptide (based on the masses of the fragment and molecular ions) are used for the data base search. Often, a single sequence tag retrieved only the correct protein from the data base.
Peptide mass fingerprint of Spot A Gel coordinates: 16kDa, 4.2 (mwt, pI)
Mass accuracy tolerance = 15 ppm This means that the mass is within 0.015 Da at m/z 1000