DESIGN AGAINST FATIGUE
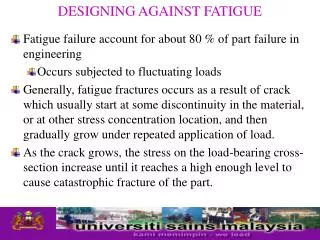
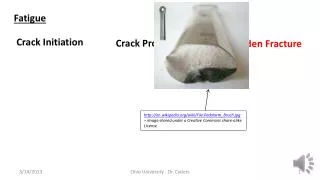
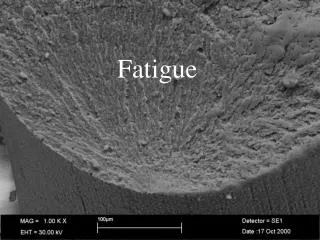
DESIGN AGAINST FATIGUE. DESIGNING AGAINST FATIGUE. Fracture surface which usually exhibits smooth areas which correspond to the gradual crack growth stage, and rough areas, which correspond to the catastrophic fracture stage.

DESIGN AGAINST FATIGUE
E N D
Presentation Transcript
DESIGNING AGAINST FATIGUE • Fracture surface which usually exhibits smooth areas which correspond to the gradual crack growth stage, and rough areas, which correspond to the catastrophic fracture stage. • The smooth parts of the fracture surface usually exhibit beach marks which occurs as a result of changes in the magnitude of the fluctuating fatigue load. • Fatigue behavior of materials is usually described by means of the S-N diagram which gives the number of cycles to failure, N as a function of the max applied alternating stress.
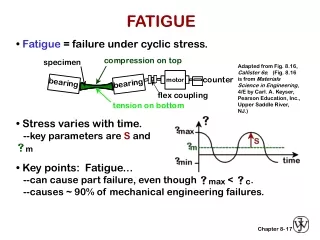
DESIGNING AGAINST FATIGUE • Types of fatigue loading • Alternating stress and Fluctuating stress • Alternating stress: Stress varies from a positive value to the negative value • Alternating tension – compression • Stress ratio, R = min / max = -1
DESIGNING AGAINST FATIGUE • Types of fatigue loading 2. Fluctuating stress: Stress varies from a positive value to a negative value. • Positive R value • Greater tensile stress than compressive stress • max = m + v • max = m - v
Fluctuating Stress Definitions Mean Stress: m = ½(max + min) Alternating Stress: v = ½(max - min) The Mean Stress is analogous to a static stress, while the Alternating Stress represents the amplitude of the fluctuating stress.
DESIGNING AGAINST FATIGUE • Figure (a) – S-N curves for carbon steel (b) - S-N curves aluminum alloy
DESIGNING AGAINST FATIGUE S-N curve is a graphical representation of the maximum applied stress versus the number of stress cycles N before the fatigue failure on a semi-log graph. For ferrous metals like steel the curve becomes asymptotic at 10^6 cycles. The completely reversed stress which a material can withstand 10^6 cycles without failure is called ENDURANCE LIMIT of the material. For non ferrous materials, the curve slopes gradually even after 10^6 cycles. These materials do not have a limiting value of endurance in true sense. In these cases endurance limit is expressed as a function of number of cycles.
DESIGNING AGAINST FATIGUE • In the majority cases, the reported fatigue strength or endurance limits of the materials are based on the test of carefully prepared small samples under laboratory condition. • Such values cannot be directly used for design purposes because the behavior of a component or structure under fatigue loading does depend not only on the fatigue or endurance limit of the material used in making it, but also an several other factors including : • Size and shape of the component or structure • Type of loading and state of stress • Stress concentration • Surface finish • Operating temperature • Service environment • Method of fabrication
DESIGNING AGAINST FATIGUE • Endurance-limit modifying factors se = kakbkckdkekfkgkhse’ Where se = endurance limit of component se’ = endurance limit experimental ka = surface finish factor (machined parts have different finish) kb = size factor (larger parts greater probability of finding defects) kc = reliability / statistical scatter factor (accounts for random variation) kd = operating T factor (accounts for diff. in working T & room T) ke = loading factor (differences in loading types) kf = stress concentration factor kg = service environment factor (action of hostile environment) kh = manufacturing processes factor (influence of fabrication parameters)
DESIGNING AGAINST FATIGUE • ka = Surface finish factor
DESIGNING AGAINST FATIGUE • kb = Size factor • Large engineering parts have lower fatigue strength than smaller test specimen • Greater is the probability of finding metallurgical flaws that can cause crack initiation • Following values can be taken as rough guidelines : • kb = 1.0 for component diameters less than 10 mm • kb = 0.9 for diameters in the range 10 to 50 mm • kb = 1 – [( D – 0.03)/15], where D is diameter expressed in inches, for sizes 50 to 225 mm.
DESIGNING AGAINST FATIGUE • kc = Reliability factor • Accounts for random variation in fatigue strength. • The following value can be taken as guidelines • kc = 0.900 for 90% reliability • kc = 0.814 for 99 % reliability • kc = 0.752 for 99.9 % reliability
DESIGNING AGAINST FATIGUE • kd = Operating temperature factor • Accounts for the difference between the test temperature and operating temperature of the component • For carbon and alloy steels, fatigue strength not affected by operating temperature – 45 to 4500C kd = 1 • At higher operating temperature • kd = 1 – 5800( T – 450 ) for T between 450 and 550oC, or • kd = 1 – 3200( T – 840 ) for T between 840 and 1020oF
DESIGNING AGAINST FATIGUE • ke = Loading factor • Accounts for the difference in loading between lab. test and service. • Different type of loading, give different stress distribution • ke = 1 for application involving bending • ke = 0.9 for axial loading • ke = 0.58 for torsional loading
DESIGNING AGAINST FATIGUE • kf = Fatigue stress concentration factor • Accounts for the stress concentration which may arise when change in cross-section • kf = endurance limit of notch-free part • endurance limit of notched part • Low strength, ductile steels are less sensitive to notched than high-strength steels
DESIGNING AGAINST FATIGUE • kg = Service environment factor • Accounts for the reduced fatigue strength due to the action of a hostile environment.
DESIGNING AGAINST FATIGUE • kh = Manufacturing process factor • Accounts for the influence of fabrication parameter • Heat treatment, cold working, residual stresses and protective coating on the fatigue material. • It is difficult to quantify, but important to included.
DESIGNING AGAINST FATIGUE • Endurance limit/Fatigue strength • The endurance limit, or fatigue strength, of a given material can usually be related to its tensile strength, as shown in table (next slide) • The endurance ratio, defined as (endurance limit/ tensile strength), can be used to predict fatigue behavior in the absence of endurance limits results. • From the table shows, endurance ratio of most ferrous alloys varies between 0.4 and 0.6
Theories of Fatigue Failure Gerber Criterion Goodman Criterion Soderberg Criterion The failure points from fatigue tests made with different steels and combinations of mean and variable stresses are plotted as a functions of variable stress and mean stress. It shows the three criteria for failure of the materials when subjected combined stress. The most significant observation is that the failure point is little related to the mean stress when stress is compressive. It means that fatigue failures are rare when the mean stress is compressive. 23
Theories of Fatigue Failure The theories are defined as given below: Gerber Criterion Goodman Criterion Soderberg Criterion 24