Download
1 / 15
210 likes | 945 Vues
FRACTURE MECHANICS AND FATIGUE DESIGN. HANS MF PANJAITAN Marinteknisk Senter Otto Nielsens Veg 10 7491 Trondheim Norway Mobile: +47-98489714. Basic Concepts. Terms relating to fatigue loading:. S max : maximum stress in cycle S min : minimum stress in cycle S m : mean stress in cycle

E N D
FRACTURE MECHANICS ANDFATIGUE DESIGN HANS MF PANJAITANMarinteknisk SenterOtto Nielsens Veg 107491 Trondheim Norway Mobile: +47-98489714
Basic Concepts • Terms relating to fatigue loading: Smax : maximum stress in cycle Smin : minimum stress in cycle Sm : mean stress in cycle Stress Range: ∆S = Smax – Smin Stress Ratio: R = Smax/Smin
Basic Concepts • Fatigue data is normally presented in a stress-life diagram – SN Diagram, where stress (or strain) range (∆S or ∆ε) versus cycle to failure (N) is plotted. • The high cycle range of fatigue life is above105 cycles (approximately), which is usually for Marine Structures. In this range, the stress is essentially elastic. SN data in the high cycle range tend to follow a log-linear relationship, the SN curve, N(∆S)m = constant • Fatigue is caused by cyclic loads, in most cases loads less than the yield stress of a given material, and is a cycle by cycle process of damage accumulation.
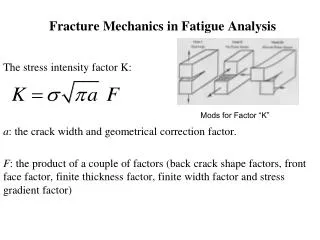
Fatigue Crack Growth • For welded joints, fatigue crack growth is dominating. The crack growth process evidently is caused by the local stress/strain at the crack tip. • The stress/strain field is characterized by one parameter, the stress intensity factor K. ∆K = ∆S (πa)1/2 F ∆S : nominal stress range a : initial crack length F : form function of stress intensity factor, dependent on external geometry, crack length,crack geometry, and configuration of loading.(F=1.12 is a good approximation) (D.P. Rooke and D.J. Cartwright, Compendium of Stress Intensity Factors, Her Majesty’s Stationary Office, London, 1976) • Crack Growth may be measured on pre-cracked specimens subjected to constant amplitude cyclic loading.
Fatigue Finite Life • In the fatigue finite life, the crack growth curve may be approximated by a straight line on a log-log plot, the Paris-Erdogan Crack Growth Relation, Paris (1960). This relation has been named ’Paris Law’. • C, m are fitting parameters, which may be taken as material parameters. Note that C has a dimension which is dependent on the value m. (Fatigue Crack Parameters C and m for C-Mn Structural Steels BS 4360 Gradde 50 or similar tested in air, Berge 1985) • a is the crack length, which is used as da, as the difference between ai (initial crack), and af (failure crack). • and N is the number of cycles to failure.
Example Case • Crack Growth of An Edge Crack ∆S = 100 MPa ∆Sda/dN = C (∆K)m ∆K = ∆S (πa)0.5 F C = 7.1 x 10⁻¹² (m,MPa) -> material properties m = 3 -> material properties ai F = 1.12 -> good approximation af
Example Case • Number of cycles to failure for the initial and final conditions given: • The major contribution to life time is when the crack is small. The crack growth rate is increasing as the crack grows. Determination of the size of the initial defect (or crack) is therefore of great importance in fatigue life analysis. The exact size of the crack at final fracture is of relatively low significance for fatigue life assessment. In many cases an infinitely long crack may be assumed, as an approximation.
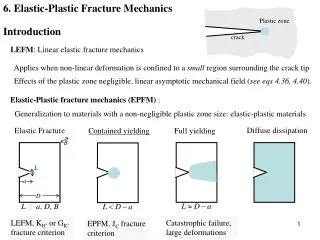
Fatigue Design Philosophy • Safe-Life Design In the safe life approach to fatigue design, the typical cases of fatigue loading which are imposed on a structural component in service are first determined. The safe-life approach depends on achieving a specified life without a development of a fatigue crack, so that the emphasis is on the prevention of fatigue crack initiation. • Fail-Safe Design The fail-safe approach, by contrast, is based on the argument that even if an individual member of a large structure fails due to fatigue cracking, there should be sufficient structural integrity in the remaining parts to enable the structure to operate safely until the crack is detected.
Cumulative Damage • The Miner Summation Fatigue design of welded structures is based on constant amplitude SN Data. A marine structure, however, will experience a load history of stochastic nature. The development of fatigue damage under stochastic or random loading is in general termed cumulative damage. Numerous theories for calculating cumulative damage from SN Data may be found in the litrature. However, the Miner summation has proved to be no worse than any other method, and much simpler. Hence, virtually all fatigue design of steel structure (bridges, cranes, offshore structures, etc.) is based on this procedure. It will be shown below that the Miner summation conforms with a fracture mechanics approach. The basic assumption in the Miner summation method is that the ’damage’ on the structure per load cycle is constant at a given stress range and equal to: where N is the constant amplitude endurance at the given stress range.
Cumulative Damage • The Miner Summation In a stress history of several stress ranges Sr,I, each with a number of cycles ni, the damage sum follows from where ni is the number of cycles of the occurred stress range, and Ni is the number of cycles to failure, as in Paris Law. Failure criterion is when: Df = 1
Cumulative Damage • Equivalent Stress Range The miner sum may be expressed in terms of an equivalent stress range, Sr,eq. Inserting for the SN-curve: So that, for the SN-curve, an equivalent stress range given by: and the fatigue life given by the total number of cycles N. Thus, the Miner sum at fracture may be represented by an equivalent stress SN-curve, which for a weld detail with a given constant amplitude SN-curve will depend on the shape of the load spectrum.
Equivalent Stress Range Cumulative Damage The Weibull distribution function can be shown to fit many stress spectra for marine structures. Cumulative load spectra for wave loaded structures may be described by a 2-parameter weibull distribution: ∆S0 - maximum stress range in the load history (extreme stress range) n - number of load cycles exceeding ∆S n0 - total number of load cycles in the load history h - Weibull shape parameter Γ - the complete Gamma function
∆S/ ∆So h = 1.5 h = 1.0 h = 0.5 Log n Cumulative Damage • Equivalent Stress Range Exceedances of stress ranges represented by the Weibull distribution with different shape parameters.
Example Case • Crack Growth of An Edge Crack ∆S1 = 30 MPa occurs in 2000 cycles; ∆S2 = 200 MPa occurs in 200 cycles ∆S(in one year load history) da/dN = C (∆K)m ∆K = ∆S (πa)0.5 F C = 7.1 x 10⁻¹² (m,MPa) -> material properties m = 3 -> material properties ai F = 1.12 -> good approximation ai = 5 mm t = 1400 mm t
Example Case • The final stage of crack growth through a plate as in this case will be rapid. For this reason, a = t is taken as a failure criterion. SN-curve to failure: N(∆S)3 = 5.00 x 10¹¹ Equivalent stress range for a one year load history: Inserted in equation for SN-curve: N = 6.68 x 10⁵ Miner sum contribution per year: D = (2200)/(6.68 x 105) = 0.0033 Life to failure: 1/D = 303 years