Automating User Interface Generation from Extended Entity-Relationship Schemas
This paper proposes a deterministically mapped approach for generating user interfaces (UIs) from Extended Entity-Relationship (EER) schemas in business applications. The methodology seeks to balance the automation benefits of data model-driven UI generation with the essential designer input to capture user requirements effectively. By utilizing a structured interaction methodology, designers can refine the initial user interface based on generated guidelines, alleviating common issues faced by traditional Automatic Interface Generation (AIG) toolkits. The presented framework aims to streamline UI design while maintaining user-centric flexibility.

Automating User Interface Generation from Extended Entity-Relationship Schemas
E N D
Presentation Transcript
User Interface Generation From The Data Schema Akhilesh Bajaj Jason Knight University of Tulsa May 13, 2007 Sixth AIS SIGSAND Symposium, Tulsa, OK
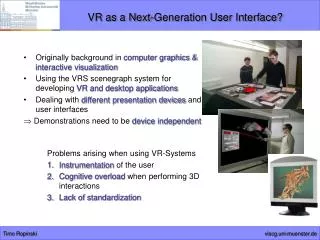
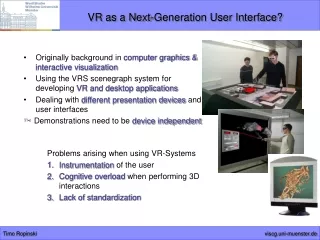
Motivation • From the early 1980-s, user interface (UI) management systems focused on providing • human designers high-level specification languages such as state transition diagrams • or event based representations to specify the interface in response to events • (Jacob, 1986, Olsen, 1986). These representations have become progressively • richer and model-based interface development tools today range from automatic • interface generators to tools that offer advice based on task representations. • Initial Automatic Interface Generation toolkits like JANUS (Balzert et al., 1996) used • only data models and attempted to derive user interfaces from these models. • This approach had the advantage of not requiring any additional work other than the • creation of the data model. However, there were several problems with this approach, • as pointed out in (Harning, 1996): • -The UI may need information from different tables on the same screen. • - Users may need summarized information, not just the raw data from the tables. • -The interface may be more effective with information displayed in the form of plots or • charts, not just alphanumeric information.
Motivation • One solution to the problems highlighted above is to explicitly require the designer to • describe the information present on each screen, along with navigation patterns, etc. • This is the approach used in tools such as TRIDENT (Bodart et al., 1995) and • TADEUS (Stary, 2000). However, this approach also has a significant disadvantage: • it places greater burden on the designer who now has to recapture the user requirements • another language, and simultaneously ensure that all the items in the domain model • (data) are represented somewhere in the new specification. We argue that this is one • reason why AIG toolkits have not met with much acceptance in the designer community, • and why most interfaces are still designed manually (Myers et al., 2000). • In this work, we attempt to balance the advantages of both approaches with regard to • business applications. The very great majority of business applications involve a • database back-end with a front-end UI, and hence we utilize the extended entity • relationship (EER) model to capture the data schema • (Chen, 1976, Smith and Smith, 1977). Our methodology uses a set of rules to map • EER objects automatically to provide a first cut user-interface, and then provides an • opportunity for a structured dialog with the user to attempt to assuage some of the • problems with the data-model-only approach.
Research Goal • To propose a deterministic mapping between an EER schema and a first cut interface • (FCI) • To develop a structured interaction methodology between the end-user and GUI • designer to create the second cut interface (SCI)
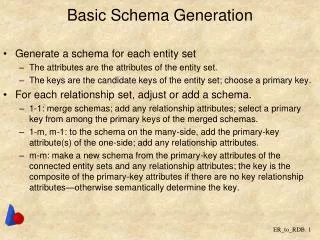
EER Concepts & FCI Generation EER schemas consist of the following concepts: -entity sets, -relationship sets with 0/1 cardinality on at least one side, and any cardinality on the other, -relationship sets with m:n cardinality and n-ary relationships -attributes of entity and relationship sets, -multi-valued attributes -entity subclasses that have extra attributes and/or extra relationships, with no multiple inheritance -weak entity sets (existence dependencies) with a unique identifier
EER Concepts & FCI Generation Entity Sets Ename i Ename i Ename i_id PK Add Update Delete Reset Exit
EER Concepts & FCI Generation Weak Entity Sets Ename j Ename j Ename i_id PK Ename j_id PK Ename i Add Update Delete Reset Exit
EER Concepts & FCI Generation m:n relationship Sets R k Ename i Ename i_id PK m Ename j_id PK R k n Ename j Add Update Delete Reset Exit
EER Concepts & FCI Generation 1:n relationship Sets Ename j Ename i Ename j_id PK 1 Ename i_id R m n Ename j Add Update Delete Reset Exit
EER Concepts & FCI Generation Multivalued attribute A i Ename i Ename i_id PK A I value PK A i Add Delete Reset Exit
EER Concepts & FCI Generation Subclass Ename s Ename i Ename i_id PK Ename s Add Update Delete Reset Exit
FCI Generation In addition, our methodology covers -navigation links for each EER construct -how each attribute may be represented -integration of basic usability concepts
Illustrative Example: SCI Generation • The FCI screens represent the major data access screens with navigation links based on EER • information. • Structured Interview Question Categories: • The steps in the SCI can be divided into the following categories: • -generation of menu screens that perform navigation to the primitive screens • -bundling of primitive screens into one window if access to more than one table • is required for a business process • -removal of attributes from certain screens (e.g.salary from the employees screen) • -addition of specific view-only information that the employee needs to perform the • data entry on a screen E.g., a summary for the sales of a particular customer for the • last year can be useful view-only information when updating the customer_category • field on the primitive screen corresponding to the customers entity set. customers • screen). • -addition of graphic reports on certain primitive screens • -addition of intuitive identifiers such as customer_name for the customers primitive • screen that allow for easier human searching in the drop down list for customers and • add more intuitive identifiers such as name to the primary keys in the drop down lists. • In order to simplify the human workload, we do not allow the addition of any updateable • fields, the idea being that each screen provides at most one updateable table, though • multiple readable tables. This is similar to the notion of updateable views.