Download
1 / 9
100 likes | 328 Vues
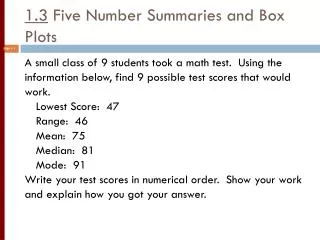
1.3 Five Number Summaries and Box Plots. A small class of 9 students took a math test. Using the information below, find 9 possible test scores that would work. Lowest Score: 47 Range: 46 Mean: 75 Median: 81 Mode: 91 Write your test scores in numerical order. Show your work

E N D
1.3 Five Number Summaries and Box Plots A small class of 9 students took a math test. Using the information below, find 9 possible test scores that would work. Lowest Score: 47 Range: 46 Mean: 75 Median: 81 Mode: 91 Write your test scores in numerical order. Show your work and explain how you got your answer.
Discovering Algebra 1.3 Five-number summaries and box plots
Five number summary • Minimum: lower extreme (lowest number) • First Quartile: (Q1) lower quartile, bottom 25% • Second Quartile: (Q2) Median, 50% • Third Quartile: (Q3) Upper quartile, top 75% • Maximum: upper extreme (biggest number)
Example(Finding the 5 number summary) • Below are the divorce rates in the following countries Step 1: Put numbers in order
Ordered List 0.4, 1.3, 1.9, 1.9, 2.0, 2.0, 2.0, 2.2, 2.2, 2.4, 2.9, 2.9, 3.0, 4.8 MAX = 4.8 MIN = 0.4 Q1 = 1.9 Q3 = 2.9 Q2 = 2.1 The five number summary is: min = 0.4 Q1 = 1.9 Q2 = 2.1 Q3 = 2.9 Range = 4.4 max = 4.8 IQR = 1 Step 2: Find the Min Step 3: Find the Max Step 4: Find Q2 (Median) Step 5: Find Q1 (25 percentile) Step 6 : Find Q3 (75 percentile)
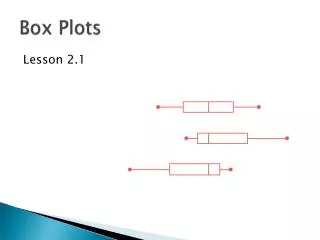
Constructing box and whisker plots • A box and whisker plot (sometimes called a boxplot) is a graph that presents information from a five-number summary.
Box Plot for Divorce Rates Q2 MIN MAX 0 0.5 1 1.5 2 2.5 3 3.5 4 4.5 5 5.5 Q1 Q3
Draw a box plot for the five-number summary for the Bulls. What do you observe in the data set? Why is this type of graph sometimes called a box-and-whisker plot?