Download
1 / 33
330 likes | 480 Vues
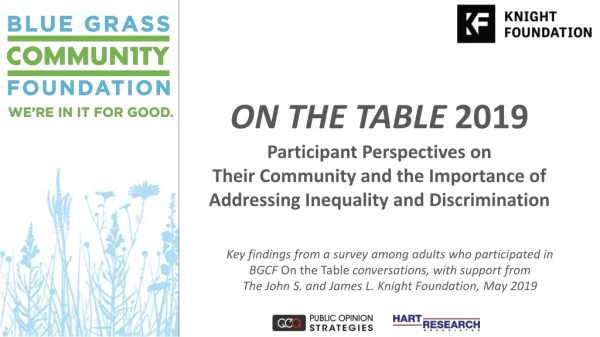
On the Table 2019 Participant Perspectives on Their Community and the Importance of Addressing Inequality and Discrimination. Key findings from a survey among adults who participated in BGCF On the Table conversations, with support from

E N D
On the Table 2019 Participant Perspectives on Their Community and the Importance of Addressing Inequality and Discrimination Key findings from a survey among adults who participated in BGCF On the Table conversations, with support from The John S. and James L. Knight Foundation, May 2019
Methodology • Blue Grass Community Foundation estimates that approximately 7,750 adults participated in On the Table conversations March 27, 2019. • This report presents findings among 642 adults who participated in On the Table conversations and completed the post-conversation survey, which was conducted online and via paper. • Survey field period: March 27 to April 10, 2019 • Notes: • Throughout this report, the term “participants” is used to refer to On the Table participants who completed the survey. • For each question, percentages are based on the total number of respondents who answered it. • “Whites” self-identify as non-Hispanic white adults. • “African Americans” self-identify as non-Hispanic African-American or black adults. • “Participants of color” self-identify as Hispanic, non-Hispanic African-American or black, Asian, another race, or biracial/multicultural adults. Throughout this deck they are referred to as “PoC.”
Profile of OTT Survey Participants: Demographics GENDER Men Women RACE/ETHNICITY Other not listed 4% say they are from a Hispanic, Latino, or Spanish-speaking background 18 to 29 60/older AGE 30 to 39 50 to 59 Whites African Americans Asians Other Bi/multiracial 40 to 49
Profile of OTT Survey Participants: Community and Politics AREA FayetteCounty Other PARTY IDENTIFICATION HOMEOWNERSHIP 26%Parent of minor child 84% VOTED in most recent local elections
Profile of OTT Survey Participants: Community Engagement COMMUNITY INVOLVEMENT: AMOUNT COMMUNITY INVOLVEMENT: WAYS Have done each in past year: 76% are very or somewhat involved in their community and neighborhood activities 24% Very involved Not at all involved 37% PARTICIPATED in OTT last year
Key Takeaways • Majorities of On the Table participants view their community positively on a number of dimensions, including residents having shared goals and priorities and providing opportunities for everyone. • There is less consensus on whether their community is more united or divided, with a majority of white participants saying it is more united and a majority of African-American participants saying it is more divided. • Hope outweighs worry about what the future holds, and this optimistic outlook is the prevailing point of view regardless of age, race and ethnicity, where one lives, or tenure living in the community. • While the top-priority issues that participants want to see their community address vary somewhat across the area as well as groups within the Bluegrass region, drug and alcohol addiction, housing issues, poverty and economic security, and jobs are challenges that consistently rise to the top. • Participants of color place a higher priority on addressing issues related to race relations, discrimination, and social justice than do white participants. • Addressing inequality and discrimination is seen as an extremely important step in making the Bluegrass region more welcoming and inclusive, which virtually all participants deem essential or very important. Continued…
Key Takeaways (continued) • Most participants view their community as doing an excellent or good job of being welcoming and inclusive when it comes to retail shops and restaurants, parks and recreational opportunities, K-through-12 schools, and arts and cultural opportunities. • That said, participants of color view their community as being welcoming and inclusive at lower rates than do white participants in all these areas. • And fewer than half of all participants rate their community as doing at least a good job being welcoming and inclusive in employment and housing opportunities. • Eight in 10 participants believe they can have an impact on making their community a better place to live, and more than than seven in 10 believe they can have an impact in encouraging or influencing discussions about inequality and discrimination in their community. • Participants are most interested in getting involved by volunteering, getting to know others with different experiences and perspectives, and joining a small group to discuss these issues. • Indeed, nearly nine in 10 participants say they are likely to take specific actions or next steps on an issue or solution they discussed at On the Table.
Majorities assess their community positively on a number of factors. My community is the perfect place for people like me Residents have shared goals/ priorities for our community My community provides opportunities for everyone 84% 75% Some-what 64% 36% 25% Strongly 16% Strongly
Perspectives on the degree to which the community provides opportunities for everyone vary across the political spectrum. My community provides opportunities for everyone: 81% 64% 61% 55% 45% 39% 36% 19% All participants Democrats Independents Republicans
White participants and participants of color have divergent views on whether their community is more united or divided. Do you think people in your community are more united or more divided when it comes to addressing important goals and challenges? 69% 66% 56% 54% 46% 44% 34% 31% All participants Whites African Americans All PoC
Significant majorities across the board are more hopeful than worried about what the future holds for their community. Looking ahead to the next five years or so, do you feel more hopeful or more worried about what the future holds for your community?
And the vast majority believe their community will be a better place to live in five years. Barring a natural disaster or other unforeseen challenges, how do you think your community will be as a place to live five years from now, compared to today? 68% Much better
Addiction, housing, poverty, and economic security are the most important issues participants want their community to address. THREE most important issues for my community to address: Cited by 10%/less: Environmental issues 10% Parks/recreation areas 7%
Priorities vary somewhat across the region and tenure within the community. THREE most important issues for my community to address:
Priorities are different for white participants and participants of color. THREE most important issues for my community to address:
Priorities vary across the political spectrum. THREE most important issues for my community to address:
Participants deem people coming together from across the area as critical to developing solutions to community challenges. How important is it that members from across your city/community come together in person on a regular basis to engage in conversations with each other in order to develop effective solutions to the issues and challenges facing our community today? 91% HIGHLY IMPORTANT
OTT participants believe they can make their community a better place to live; younger participants think so at even higher rates. Impact people like me can have in making my community a better place: 81% Big impact
Nonprofits and community organizations are viewed as having the greatest impact on making the community a better place to live. TWO or THREE groups that have greatest impact on making my community a better place to live:
Nonprofits are top across the board; perspectives on others that are having the greatest impact vary somewhat. TWO or THREE groups that have greatest impact on making my community a better place to live:
Making the Bluegrass region more welcoming and inclusive is deemed extremely important, and addressing inequality and discrimination is viewed as an important action to achieving it. Importance of making Bluegrass region a more welcoming and inclusive community [In that case], how important is it to address inequality and discrimination affecting many people, including racial, ethnic, religious minorities, women, LGBTQ, and people with disabilities? 94% HIGHLY IMPORTANT 91% HIGHLY IMPORTANT
Majorities believe their community is a good place to live for a variety of different groups within the community.
Participants are less likely to see their community as a good place to live for low-income families, people with disabilities, and certain ethnic and religious minorities.
White participants and participants of color have different views on the degree to which the community is welcoming and inclusive in a variety of areas. How would you rate the job your community is doing in being welcoming and inclusive of different kinds of people in each of these areas? 67% 67% 63% 61% 43% 30%
Most OTT participants believe they can have an impact in encouraging and influencing discussions about inequality and discrimination; younger participants think so at even higher rates. Impact I personally can have in encouraging or influencing discussions in my community about inequality and discrimination in an effort to make our community more welcoming and inclusive: 72% Big impact
Volunteering and getting to know others with different experiences and perspectives are the ways participants are most interested in address inequality and discrimination, but only one in four say there are many opportunities to do so. THREE ways in which I would be most interested in getting involved to address inequality/discrimination and make our community more welcoming/inclusive: Opportunities for me to get involved:
Word of mouth and communication from the foundation are the top ways participants learned about On the Table. How did you hear about On the Table?
OTT helped most participants learn about important issues and better understand how they can take action on issues and challenges facing their community. Which of these apply to your On the Table experience? I spoke with at least one person that I did not already know The conversation helped me better understand how I can take action to help address issues and challenges in my community I learned about important issues in my community I exchanged contact information with at least one person that I did not already know
And most say they are likely to take a specific action regarding an issue or solution they discussed at On the Table. How likely are you to take specific actions or next steps regarding an issue or solution discussed at the On the Table conversation you participated in? 87% Very likely