Download
1 / 13
130 likes | 257 Vues
10% Worst Performing Circuits Reliability Program SWEDE Conference San Antonio, TX May 10, 2007 Kenton M. Brannan, P.E. kenton.brannan@centerpointenergy.com. Historical Approach Enhanced Process Identification of Probable 10% Circuits Circuit Evaluation & Improvements

E N D
10% Worst Performing Circuits Reliability Program SWEDE Conference San Antonio, TX May 10, 2007 Kenton M. Brannan, P.E. kenton.brannan@centerpointenergy.com
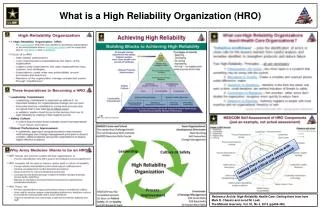
Historical Approach Enhanced Process Identification of Probable 10% Circuits Circuit Evaluation & Improvements Reliability Oversight Committee Documentation Procedure Tree Trim Process Notable Changes Process Assessment Anticipated Process Enhancements 10% Circuit Reliability Program
10% Circuit Standard Performance measured from Jan 1 to Dec 31 Prefer to have improvements made by Jan 1 CNP’s Historical Approach Circuit reviews began in 4th Quarter Infrared and Tree Trim processes separate from 10% circuit review No specific deadlines to complete action plans Differing methods among service centers Historical Approach
Identification of Probable 10% Circuits Begins upon conclusion of 2nd Quarter with June YTD circuit performance data Data available for analysis by mid-July Begin with top 30 circuits from SAIDI/SAIFI lists Confidence level: ≈ 25% of top 10 % circuits ≈ 15 circuits are added each month until year end Final 10% circuits (≈ 40) are identified by mid-January from year end data Enhanced Process
Circuit Evaluation & Improvements – 90 Days 90 day timeframe begins on date of identification as probable 10% circuit 1st 45 days Perform root cause analysis and develop action plan to improve circuit performance Attempt to achieve “Reduce-To” values 2nd 45 days Complete field work called for in action plan Enhanced Process
Reliability Oversight Committee Consists of engineering and operations personnel Evaluates proposed action plans (within 1st 45 days) Documentation Procedure Progress tracked via MS SharePoint Reports Circuit Level Summary Report System Reliability Dashboards Enhanced Process
Focus 10% Circuits – 4th quarter of the previous year and 1st quarter of the new year All Circuits – 2nd and 3rd quarters 4th quarter Selection Criteria Information on probable 10% circuits Outage data due to vegetation & wind time since last trim Emphasis on 10% circuits with highest priority given to repeat and 300% circuits Tree Trim Process
Timeframe Begin closely analyzing probable 10% circuits in July rather than October or November Infrared Process Increase current inspection cycle from 3 years to 5 5 year system focus (≈ 300 circuits/year) Additional focus on 10% circuits (≈ 200 circuits) Tree Trim New process has been enhanced to incorporate the 10% circuits in the proactive tree trimming strategy Notable Changes
Root cause analysis & circuit work is being completed earlier in the year as compared to past years Reliability Oversight Committee Identifying synergies Sharing of resources occurring Process very effective thus far Process Assessment
Identify probable 300% circuits before 2nd Q ends Refine target SAIDI and SAIFI values using historical values and statistical methods Abandon MS SharePoint and move to SAP/Business Warehouse Anticipated Process Enhancements