1 / 1

ROC Curve Analysis of CD177 Expression as a Predictor of GI Immune-Related Adverse Events

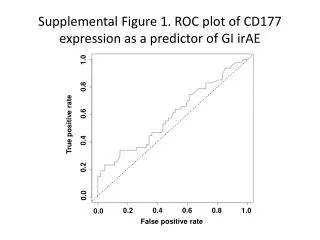
Supplemental Figure 1 presents a Receiver Operating Characteristic (ROC) plot analyzing CD177 expression levels as a predictive biomarker for gastrointestinal immune-related adverse events (GI irAEs). The plot illustrates the true positive rate against the false positive rate, providing insights into the sensitivity and specificity of CD177 in identifying patients at risk for GI irAEs. A higher area under the curve (AUC) indicates a better predictive capability, making CD177 a potential clinical tool in managing patient care during immunotherapy.

xue
Télécharger la présentation

ROC Curve Analysis of CD177 Expression as a Predictor of GI Immune-Related Adverse Events

An Image/Link below is provided (as is) to download presentation Download Policy: Content on the Website is provided to you AS IS for your information and personal use and may not be sold / licensed / shared on other websites without getting consent from its author. Content is provided to you AS IS for your information and personal use only. Download presentation by click this link. While downloading, if for some reason you are not able to download a presentation, the publisher may have deleted the file from their server. During download, if you can't get a presentation, the file might be deleted by the publisher.

E N D

Presentation Transcript


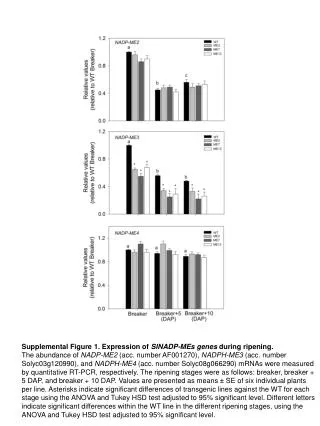
  1. Supplemental Figure 1. ROC plot of CD177 expression as a predictor of GI irAE 1.0 0.8 0.6 True positive rate 0.4 0.2 0.0 0.2 0.4 0.6 0.8 1.0 0.0 False positive rate

More Related