Inference About Prediction and Checking the Regression Assumptions
90 likes | 195 Vues
Explore how to predict responses and check assumptions using the LSRL method. Learn to estimate mean and individual responses with confidence and prediction intervals. Verify linear relationship, uniform response variation, and normal distribution. <br>

Inference About Prediction and Checking the Regression Assumptions
E N D
Presentation Transcript
Inference About Prediction and Checking the Regression Assumptions Sections 14.2 and 14.3
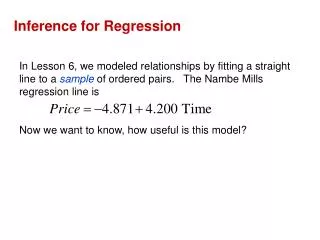
LSRL • We use the LSRL to predict a response to a specific value of x by substituting. • We can give a confidence interval to describe how accurate a prediction is. • Depends on whether: • You want to predict the mean y for all the times that x is a certain value. • You want to predict the value of y for one specific time that x is a certain value.
To Estimate Mean Response: • µy = α + βx* (x* is specific value of x) • Use a confidence interval. • y-hat ± t* SEµ-hat To Estimate Individual Response: • µy = α + βx* (x* is specific value of x) • Use a prediction interval. • y-hat ± t* SEy-hat
Use Software Printouts Example: Predict what the average gas consumption would be for any month with an average of 20 degree-day days. Predict for the individual month of March of this year. Remember LSRL: Y-hat = 1.0892 + .1890x Fit Stdev.Fit 95% C.I. 95% P.I. 4.8692 .0855 (4.6858, 5.0526) (4.1193, 5.6191) SEµ-hat
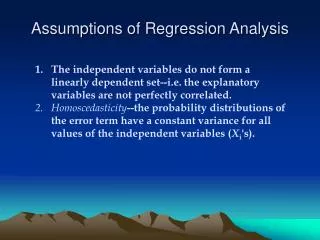
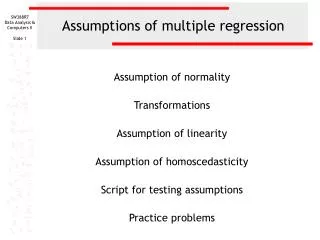
Checking Regression Assumptions: • The true relationship is linear • The standard deviation of the response about the true line is the same everywhere. • The response varies normally about the true regression line.
True Relationship is Linear: • Look at scatterplot: linear? • Plot residuals: pattern?
Standard Deviation • The standard deviation of the response about the true line is the same everywhere. • Look at scatterplot. • Look at residuals plot: not safe if more, or less, scatter as x increases.
Response Varies Normally • Response varies normally about the true regression line. • Make a histogram or stemplot of residuals and check for normality. • Normal Probability Plot: linear? • Minor nonnormality is ok; influential observations can greatly affect results. • Prediction interval relies on normality, not just approximately normal, so our prediction intervals are rough approximations.