Lean Analysis in Manufacturing: Innovative Automation & Simulation Techniques
180 likes | 270 Vues
Explore cutting-edge automation technologies and simulation methodologies in manufacturing to optimize processes. Learn about Lean Six Sigma, inventory strategies, capacity changes impact analysis, and more.

Lean Analysis in Manufacturing: Innovative Automation & Simulation Techniques
E N D
Presentation Transcript
AUTOMATION IN MANUFACTURING Leading-Edge Technologies and Applications A Lean Analysis Methodology Using SimulationFebruary 20, 2009 JimCurry@OpStat.comwww.OpStat.com
Production & Operations Analysis • MSMOT Courses • Supply Chain Design • Manufacturing Process Design • Lean Improvement • Methodology • Statistical Analysis • Simulation • Optimization
FORBES.com Innovation During The Great Disruption • “Another shining light is likely to be companies that have made substantial progress in their efforts to make innovation systematic. Companies that have already placed their bets on innovation can double down, creating multi-year gaps over their competitors. For example, PROCTER & GAMBLE (nyse: PG - news - people ), JOHNSON & JOHNSON (nyse: JNJ - news - people ), …. have all made public commitments to growth through innovation.” Innovation During The Great DisruptionScott Anthony, 01.16.09,
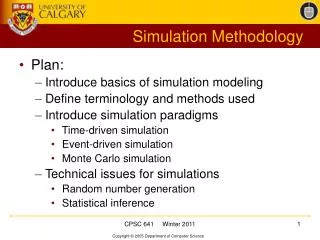
What is “Lean” / Why Simulation? • The term goes back to the Toyota Production System’s Just-in-Time techniques • Lean Manufacturing expanded to Lean Six Sigma & Lean Supply Chain: to optimize cross-functional processes • Simulation allows us to: • Evaluate things other tools cannot, such as impacts of product mix and setups, for complex operations with many products • Analyze impacts of variability in processes and demand, with real-world time sensitive parameters • Develop replenishment & inventory strategy across locations, • Analyze impacts of process and capacity changes on performance.
Results of Multiple Simulations are Compared on the Same Graph Key Metrics Can Be Compared For Multiple Scenarios Inventory Levels Cycle Times
Case Study: Lean Simulation Model Test a New Demand Pull Process Before Model for Laminated Plastic Manufacturing Process Laminating & cutting Extrusion Packaging Repair Centers Demand 60 + finished products Repair Centers Limited storage space MRP Push 3 Passes on the same equipment Each work center operates on a different work schedule. 5 days/week 7 days/week 7 days/week
Lean Techniques in Model When to Authorize Production Incorporate Variability Kanbans One-Piece Flow EPEI (Every Part Every Interval) Constant Work In Process (CONWIP) Batch Schedules Downtime Setups / Changeovers Yield Scrap Lead Times Test Factory Changes Metrics Setup Reduction Shared Equipment Resources Skilled Labor Work Center Schedules Takt Times / Rates OEE (Overall Equipment Effectiveness) Cycle Times
Pull Process: Scheduling & Structured Replenishment Rules After Model with Best Practice Just-in-Time Techniques
“Every Product Every Interval” (EPEI) • Make every product within this cycle: • Sets the maximum lead time • Dictates inventory turns & working capital ~60 total products; in 6 product groups As demand arrives for each product, the production order is assigned to the next available cycle spot Fairly complex setup rules between product groups
Packaging operation is sometimes starved Not meeting demand Before: throughput/service problem
Improvement in Packager utilization Better Demand fulfillment After: Increased & consistent flow
Some Real Benefits • Postponement strategy ( the Dell method ) - 30% inventory reduction; with service improvement to 97+% • Synchronized flow - reduced cycle time 18 to 13 weeks • Kanbans – inventoryreduced 20%across a network • Demand pull – delayed need for major capacity upgrade • Focus on continuous improvement • A traditional method such as value-stream mapping becomes dynamic • A model is a tool for kaizen teams and six sigma black belts
Hierarchical blocks for each plant or work center Each work-center has flow logic for material, and schedule input Each line has logic for each equipment set Hierarchical Model Building Excel interfaces for all inputs & outputs provides ease of use
Job Shop Simulation Model Jobs from multiple sources Setup Process Completed Jobs Resources Each Job assigned a Job Type Each Job Type creates a series of Job IDs to be executed Each Job ID has parameters that define resources & duration Skills Equip
Confidence intervals for results, e.g., end-to-end time & utilization Job Shop Example Statistical Outputs