Download
1 / 63
660 likes | 1.08k Vues
Water and Water Pollution. Chapter 11 Brian W, Kate H, Amanda K. Key Concepts. Why is water so important? How much water is available? How much water are we using? What causes water shortages and what can be done? What causes floods and how can they be avoided?

E N D
Water and Water Pollution Chapter 11 Brian W, Kate H, Amanda K
Key Concepts • Why is water so important? • How much water is available? • How much water are we using? • What causes water shortages and what can be done? • What causes floods and how can they be avoided? • Sources, types, and risks of water pollution • Preventing and reducing water pollution • Sustainable use of water resources
Water shortages Nile River Jordan Basin- water short Tigris and Euphrates rivers Jordan, Syria, Palestine, and Israel competing for the water Peacefully solving the problems Water Conflicts in the Middle East Fig. 11-1, p. 236
Earth’s Water Budget All water Fresh water Readily accessible fresh water Groundwater 0.592% Biota 0.0001% Rivers 0.0001% Lakes 0.007% 0.014% Fresh water 2.6% Atmospheric water vapor 0.001% Oceans and saline lakes 97.4% Ice caps and glaciers 1.984% Soil moisture 0.005% Fig. 11-2, p. 238
Groundwater • Zone of saturation- under the ground, spaces between rocks and soil that fill with water • Water table- top of zone of saturation, falls in dry weather, rises in wet weather • Aquifers- porous, saturated layers of sand, gravel, or bedrock through which groundwater flows • Natural recharge- precipitation percolates downward through soil and rock which replenishes aquifers naturally
Groundwater Systems Unconfined Aquifer Recharge Area Evaporation and transpiration Evaporation Precipitation Confined Recharge Area Runoff Flowing artesian well Recharge Unconfined Aquifer Stream Well requiring a pump Water table Lake Infiltration Infiltration Unconfined aquifer Less permeable material such as clay Confined aquifer Confiningimpermeable rock layer Fig. 11-3, p. 239
Use of Water Resources • Runoff use: about 54% • Freshwater use- • 20% - industry • 10% - cities and residents • 70% - irrigation of 1/5 of the world’s cropland (40% of world food) • Domestic, agricultural, and industrial use • US freshwater resources- more than enough freshwater resources. East- energy, cooling and manufacturing. West- irrigation
Annual Precipitation and Water-deficit Regions of the Continental US Fig. 11-4a, p. 240
Water Hot Spots in Western States Wash. N.D. Montana Oregon S.D. Idaho Wyoming Neb. Nevada Colo. Utah Kansas California Oak. N.M. Texas Highly likely conflict potential Substantial conflict potential Moderate conflict potential Unmet rural water needs Fig. 11-5, p. 240
Freshwater Shortages • Causes of water scarcity: dry climate and too many people • Stresses on world’s major river systems • 1 of 6 people have no regular access to clean water • Poverty hinders access to water • Hydrological poverty
Stress on World’s River Basins Europe North America Asia Africa South America Australia Stress High None Fig. 11-6, p. 241
Hydrological Poverty • An increasing number of governments are gaining ownership of public water by hiring private companies to manage them. • In Cochabamba, Bolivia, 60% of the water is being lost through leaking pipes. • Two potential problems of privatized water systems: • Since they have an incentive to sell as much water as they can, they don’t conserve well. • Because of lack of money to pay water bills, poor will continue to be left out Fig. 11-7, p. 241
Increasing Freshwater Supplies • Building damns • Bringing in water from somewhere else • Withdrawing groundwater • Converting salt water to freshwater (desalinization) • Wasting less water • Importing food
Tradeoffs of Large Dams and Reservoirs Large losses of water through evaporation Flooded land destroys forests or cropland and displaces people Migration and spawning of some fish are disrupted Downstream cropland and estuaries are deprived of nutrient-rich silt Provides water for year-round irrigation of cropland Reservoir is useful for recreation and fishing Can produce cheap electricity (hydropower) Downstream flooding is reduced Fig. 11-8, p. 243
Ecological Services of Rivers N a t u r a l C a p i t a l Ecological Services of Rivers • Deliver nutrients to sea to help sustain coastal fisheries • Deposit silt that maintains deltas • Purify water • Renew and renourish wetlands • Provide habitats for wildlife Fig. 11-9, p. 243
California Water Project and Central Arizona Project CALIFORNIA NEVADA Shasta Lake UTAH Oroville Dam and Reservoir Sacramento River Lake Tahoe Feather River North Bay Aqueduct Sacramento San Francisco Hoover Dam and Reservoir (Lake Mead) South Bay Aqueduct Fresno San Joaquin Valley San Luis Dam and Reservoir Colorado River Los Angeles Aqueduct California Aqueduct ARIZONA Colorado River Aqueduct Santa Barbara Central Arizona Project Los Angeles Phoenix Salton Sea San Diego Tucson Fig. 11-10, p. 244 MEXICO
Aral Sea Disaster • Large-scale water transfers in dry central Asia • Salinity • Wetland destruction and wildlife • Fish extinctions and fishing • Wind-blown salt • Water pollution • Climatic changes • Restoration efforts
Shrinking Aral Sea Fig. 11-11, p. 245
Stranded Ship at the Aral Sea Fig. 11-12, p. 245
Tradeoffs of Withdrawing Groundwater Trade-Offs Withdrawing Groundwater Advantages Disadvantages Good source of water for drinking and irrigation Available year-round Exists almost everywhere Renewable if not over- pumped or contaminated No evaporation losses Cheaper to extract than most surface waters Aquifier depletion from over- pumping Sinking of land (subsidence) when water removed Polluted aquifiers unusable for decades or centuries Saltwater intrusion into drinking water supplies near coastal areas Reduced water flows into streams, lakes, estuaries, and wetlands Increased cost, energy use, and contamination from deeper wells Fig. 11-13, p. 246
Aquifer Depletion Groundwater Overdrafts: High Moderate Minor or none Fig. 11-14, p. 246
Groundwater Depletion Solutions Groundwater Depletion Prevention Control Raise price of water to discourage waste Tax water pumped from Wells near surface water Set and enforce minimum stream flow levels Waste less water Subsidize water conservation Ban new wells in aquifiers near surface waters Buy and retire ground- water withdrawal rights in critical areas Do not grow water- intensive crops in dry areas Reduce birth rates Fig. 11-16, p. 247
Saltwater Intrusion into Coastal Water Wells- groundwater depletion Well contaminated with saltwater Major irrigation well Water table Sea Level Saltwater Fresh groundwater aquifer Seafloor Interface Saltwater Intrusion Interface Normal Interface Fig. 11-15, p. 247
Desalination • Removal of salts from ocean or brackish waters to produce useable water • Distillation method-heating salt water until it evaporates, leaves behind salts in solid form, and condenses as fresh water • Reverse osmosis method- pumping salt water at high pressure through a thin membrane with pores that allow water molecules, but not most dissolved salts, to pass through. High pressure is used to push fresh water out of salt water • Used in 120 countries • Major problems: high cost and a lot of brine wastes (contains salt and other minerals) • Research is needed • Significant desalination is practical only for wealthy and water-short countries and cities that can afford its high costs
Reducing Water Waste • Benefits of water conservation- Reduce leakage and save water, Improve irrigation • Increase water prices (we charge too little), no government subsidies (provide irrigation water, electricity, and diesel fuel for farmers at below market prices), and water waste • Using less water in homes and businesses
Major Types of Irrigation Systems Drip Irrigation (efficiency 90-95%) Above- or below-ground pipes or tubes deliver water to individual plant roots. Gravity Flow (efficiency 60% and 80% with surge valves) Water usually comes from an aqueduct system or a nearby river. Center Pivot (efficiency 80% with low-pressure sprinkler and 90–95% with LEPA sprinkler) Water usually pumped from underground and sprayed from mobile boom with sprinklers. Fig. 11-17, p. 249
Reducing Irrigation Water Waste Solutions Reducing Irrigation Water Waste • Lining canals bring water to irrigation ditches • Leveling fields with lasers • Irrigating at night to reduce evaporation • Using soil and satellite sensorsand computer systems to monitor soil moisture and add water only when necessary • Polyculture • Organic Farming • Growing water-efficient crops using drought-resistant and salt tolerant crops varieties • Irrigating with treated urban waste water • Importing water-intensive crops and meat Fig. 11-18, p. 250
Reducing Water Waste Solutions Reducing Water Waste • Redesign manufacturing processes • Landscape yards with plants that require little water • Use drip irrigation • Fix water leaks • Use water meters and charge for all municipal water use • Use waterless composting toilets • Require water conservation in water-short cities • Use water-saving toilets, showerheads, and front-loading clothes washers • Collect and reuse household water to irrigate lawns and nonedible plants • Purify and reuse water for houses, apartments, and office buildings Fig. 11-19, p. 250
Using Water More Sustainably • Blue revolution- • Using technology to irrigate crops more efficiently and to save water in industries and homes • Economic and political policies to remove subsidies that cause water to be under priced and wasted, while guaranteeing low prices for low-income consumers • Switch to new waste-treatment systems • Leave enough water in nature • Help by using and wasting less water • Cut waste • Raise water prices • Drier waste treatment • Preserve forests • Slow population growth
Sustainable Water Use Solutions Sustainable Water Use • Not depleting aquifers • Preserving ecological health of aquatic systems • Preserving water quality • Integrated watershed management • Agreements among regions and countries sharing surface water resources • Outside party mediation of water disputes between nations • Marketing of water rights • Raising water prices • Wasting less water • Decreasing government subsides for supplying water • Increasing government subsides for reducing water waste • Slowing population growth Fig. 11-20, p. 251
What Can We Do? What Can You Do? Water Use and Waste • Use water-saving toilets, showerheads, and faucet aerators • Shower instead of taking baths, and take short showers. • Repair water leaks. • Turn off sink faucets while brushing teeth, shaving, or washing. • Wash only full loads of clothes or use the lowest possible water-level setting for smaller loads. • Wash a car from a bucket of soapy water, and use the hose for rinsing only. • If you use a commercial car wash, try to find one that recycles its water. • Replace your lawn with native plants that need little if any watering. • Water lawns and garden in the early morning or evening. • Use drip irrigation and mulch for gardens and flowerbeds. • Use recycled (gray) water for watering lawns and houseplants and for washing cars. Fig. 11-21, p. 251
Benefits of Floodplains • Floodplain- a flood happens when water in a stream overflows its normal channel and spills into the adjacent area • Highly productive wetlands • Provide natural flood and erosion control • Maintain high water quality • Recharge groundwater • Fertile soils • Nearby rivers for use and recreation • Flatlands for urbanization and farming
Dangers of Floodplains and Floods • Deadly and destructive (considered natural disaster) • Human activities worsen floods • Failing dams and water diversion • Bangladesh- One of the world’s most densely populated countries. Due to overpopulation in the Himalayan watershed, great floods are now occurring every 4 years instead of every 50 years because of deforestation, overgrazing, and unsustainable farming.
Before and During a Flood in St. Louis, Missouri This image shows the negative effects of living on a flood plain. Fig. 11-22, p. 252
Flooding After Deforestation of a Hillside Fig. 11-23, p. 253
Reducing Flood Risks • Channelization- straighten and deepen streams • Levees (floodwalls)- contain and speed up stream flow • Dams- storing water • Protect and restore wetlands- natural flood control • Identify and manage flood-prone areas • Precautionary approach- to think carefully about where we live
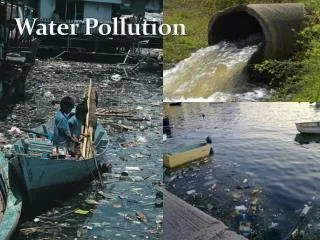
Water Pollution • What is water pollution? Any chemical, biological, or physical change in water quality that harms living organisms or makes water unsuitable for desired uses • Point sources- discharge pollutants at specific locations • Nonpoint sources- scattered and diffuse and can’t be traced to any single site of discharge • Is the water safe to drink? 95% of people in developed countries have access to safe drinking water. According to the WHO, 1 in every 5 people on Earth don’t have access to clean drinking water. Every day 9300 people die from infectious diseases from contaminated water.
Polluted Streams • Factors influencing stream recovery from pollution • Oxygen sag curve • Importance of wastewater treatment plants- so you don’t put contaminated water back into streams, lakes, and bays • Improvements in quality of US streams- water pollution control laws in 1970 increased the amount of wastewater treatment plants in the US • Cuyahoga River of Ohio- Caught fire twice in a ten year span. Resulted in new laws prohibiting the discharge of industrial wastes into rivers • Effect of regulations in US- cleaner streams, loss of pollution • Problems with nonpoint, accidental and illegal releases- can’t really stop it easily • Problems in developing countries- Half of the world’s 500 rivers are heavily polluted, most of them going through developing countries. Only 10% of sewage from Chinese cities is treated.
Pollution in Streams(Oxygen sag curve) Normal clean water organisms (trout, perch, bass, mayfly, stonefly) Trash fish (carp, gar, leeches) Fish absent, fungi, sludge worms, bacteria (anaerobic) Trash fish (carp, gar, leeches) Normal clean water organisms (trout, perch, bass, mayfly, stonefly) 8 ppm Types of organisms 8 ppm Dissolved oxygen (ppm) Biological oxygen demand Clean Zone Recovery Zone Septic Zone Decomposition Zone Clean Zone Fig. 11-24, p. 256
Lake Pollution • Dilution less effective than with streams • Stratification (layers in the lake) and relatively little flow hinder rapid dilution of pollutants • Lakes more vulnerable to pollutants than streams • How pollutants enter lakes- runoff from watersheds, farmland, animal feedlots, urban areas, mining sites, sewage • Eutrophication: name given to the natural nutrient enrichment of lakes mostly from runoff of plant nutrients such as nitrates and phosphates from surrounding land. In hot weather or drought the nutrient overload produces algae, creating green lakes. • Oligotrophic lake- low in nutrients (clear) • Eutrophic lake- green lakes • Cultural eutrophication- Human activities accelerate the input of plant nutrients. • Preventing or removing eutrophication • Advanced waste treatment to remove nitrates and phosphates • Ban or limit the use of phosphates in household detergents • Employ soil conservation and land use control to reduce nutrient runoff
Oligotrophic and Eutrophic Lakes Oligotrophic (clear lakes) Eutrophic (green lakes) Fig. 11-25, p. 257
Groundwater Pollution: Causes and Persistence • Sources of groundwater pollution- oil spills, paint thinners, sewage, hazardous wastes injection wells, waste lagoons, landfills • Slow flowing: Groundwater flows so slowly (1 foot per day) that contaminants are not diluted and dispersed effectively. • Consequences of lower dissolved oxygen- dissolved oxygen helps decompose many contaminants • Fewer bacteria to decompose wastes • Cooler temperatures: slow down chemical reactions • “Degradable” and nondegradable wastes in groundwater
Groundwater Pollution Polluted air Hazardous waste injection well Pesticides and fertilizers De-icing road salt Coal strip mine runoff Buried gasoline and solvent tank Pumping well Gasoline station Water pumping well Cesspool septic tank Waste lagoon Sewer Landfill Leakage from faulty casing Accidental spills Discharge Unconfined freshwater aquifer Confined aquifer Confined freshwater aquifer Groundwater flow Fig. 11-26, p. 258
Extent of Groundwater Pollution • Not much is known about groundwater pollution • Organic contaminants, including fuel leaks • Arsenic- contaminates drinking water that comes from underground wells • Protecting groundwater: Prevention is best
Preventing and Cleaning Up Pollution in Groundwater Solutions Groundwater Pollution Prevention Cleanup Find substitutes for toxic chemicals Pump to surface, clean, and return to aquifer (very expensive) Keep toxic chemicals out of the environment Install monitoring wells near landfills and underground tanks Inject microorganisms to clean up contamination (less expensive but still costly) Require leak detectors on underground tanks Ban hazardous waste disposal in landfills and injection wells Pump nanoparticles of inorganic compounds to remove pollutants (may be the cheapest, easiest, and most effective method but is still being developed) Store harmful liquids in aboveground tanks with leak detection and collection systems Fig. 11-27, p. 259
Ocean Pollution • How much pollution can oceans tolerate? Oceans can dilute, disperse, and degrade large amounts of pollutants, especially in deep ocean areas • Ocean dumping controversies • Some scientists think that it is best to dump pollutants in deep water instead of burying them. • We don’t know enough about the ocean so we may not know the harmful effects in the long run
Coastal Water Pollution Urban sprawl Bacteria and viruses from sewers and septic tanks contaminate shellfish beds and close beaches; runoff of fertilization from lawns adds nitrogen and phosphorus. Cities Toxic metals and oil from streets and parking lots pollute waters; sewage adds nitrogen and phosphorus. Industry Nitrogen oxides from autos and smokestacks; toxic chemicals, and heavy metals in effluents flow into bays and estuaries. Constructionsites Sediments are washed into waterways, choking fish and plants, clouding waters, and blocking sunlight. Farms Run off of pesticides, manure, and fertilizers adds toxins and excess nitrogen and phosphorus. Red tides Excess nitrogen causes explosive growth of toxic microscopic algae, poisoning fish and marine mammals. Closed shellfish beds Closed beach Oxygen-depleted zone Toxic sediments Chemicals and toxic metals contaminate shellfish beds, kill spawning fish, and accumulate in the tissues of bottom feeders. Healthy zone Clear, oxygen-rich waters promote growth of plankton and sea grasses, and support fish. Oxygen-depleted zone Sedimentation and algae overgrowth reduce sunlight, kill beneficial sea grasses, use up oxygen, and degrade habitat. Fig. 11-28, p. 260
Oxygen-depleted Water in the Gulf of Mexico Mississippi River Basin Ohio River Mississippi River Missouri River LOUISIANA Mississippi River Depleted Oxygen Gulf of Mexico Fig. 11-29, p. 261
Largest US estuary Pollution “sink” Oxygen depletion Chesapeake Bay Program Chesapeake Bay Fig. 11-30, p. 261
Effects of Oil on Ocean Life • Crude and refined petroleum- most oil pollution comes from human activities on land • Tanker accidents and blowouts • Exxon Valdez- tanker that spilled oil into Alaska’s Prince William Sound (waterway) • Volatile hydrocarbons kill larvae- hydrocarbons immediately kill aquatic organisms • Tar-like globs coat birds and marine mammals • Oil destroys insulation and buoyancy • Heavy oil sinks and kills bottom organisms • Coral reefs die • Slow recovery • Oil slicks ruin beaches • Limited effectiveness of clean up methods