Download

1 / 11
110 likes | 225 Vues
Demand forecasting is a complex yet crucial aspect of business strategy, significantly impacting profits. Accurate demand measurement faces hurdles like product lifecycle changes, new market demographics, and inaccurate sales data. Historical data often misrepresents current demand due to stock issues or theft, complicating future predictions. To enhance forecasting, businesses should leverage detailed sales data, RFID technology, and monitor various factors—including competitor prices and weather. A 10% improvement in forecasting can yield substantial cost savings and profit increases, making accurate demand insight invaluable.

E N D
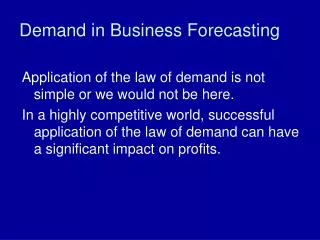
Demand in Business Forecasting Application of the law of demand is not simple or we would not be here. In a highly competitive world, successful application of the law of demand can have a significant impact on profits.
Why Demand Is Not Easy to Measure • Changes in the design of products and entry of new products mean limited lifecycles. Such changes make forecasting demand more difficult because you use data from previous products and time periods. • Expanding business to new markets means new demographics (customer base), facing new competitors, different seasonal factors, packaging requirements, and distributional channels. Seller of one product may really be in multiple mini-markets.
Accurate Measures Difficult • Difficulty in interpretation of historical data: Sales, orders, shipments and invoices are historical data that can cause confusion. • This may be innocent; evidence of theft; evidence of bad record keeping. The numbers rarely match up. Besides trying to measure demand; an opportunity to try to understand company data accuracy.
Measurement Difficulties • Sales today may not reflect future demand as substitutes or other factors that affect demand change. • Demand is often underestimated when based on sales data. Example: were sales in a given time period actual demand or did the stock run out, thereby cutting sales? • Most data is old; look for more “real time” data. YRC Worldwide (transport) moves quickly to reduce its fleet and employee base when it sees shipments shrinking. Checks weight of shipments, number, frequency, etc. looking for signs of change in industry conditions.
Demand Forecasting • Forecasts are statistical estimates for the future. They can be improved by determining probability distributions for demand points by location and for specific times. • Try to measure the degree to which actual demand deviates from prior demand forecasts. Improve point estimates. Revision is a good idea as time passes—were the estimates made six months ago for next year still the best estimate? • Based on experimenting with data, determine relevant time period. Example: Anheuser-Busch uses five-year historical data to better understand product lifecycles and seasonal demand.
Improving Demand Measures • Detailed point-of-sale data (bar codes on products) allows better estimates. These can be compared to vendor inventory or other data sources to check accuracy. • RFID (radio frequency identification devices) provide better control of point-of-sale measures and inventory from production through distribution to the shelf level. Toyota requires these on all parts to track location of parts made around the world—what is where, when. Better inventory control means less waste.
Improving Demand Measures • More measures of possibly relevant factors: competitor prices, regional events, demographics, and weather. Some of this information is low cost. Computer time is low cost. Analysis is not. • Remember: the better we forecast demand for output, the better we control inputs (cost).
Benefits of Good Measures • Information and forecasting is not costless, but a 10% improvement in forecasting can increase profits by reducing: number of lost sales; costs of handling excess goods; and the costs of buying, insuring, storing, and disposing of excess inventory. • Firms that estimate demand can reduce costs, set prices more accurately, and increase profits.
Successful Practice One form of this is in “price-optimization software” that looks to past sales to determine where to set initial prices today and when to begin to discount. This helps avoid panic discounting if initial sales are weaker than expected. Nordstrom’s attributed much of its increase in profit margin from 5.2% in 2004 to 10.6% in 2006 to impact of the software.
Similar points from the Harvard Business Review Studies of companies show many pricing errors due to lack of internal controls. Common problems: Invoices do not match prices quoted. Discounts granted by sales agents are larger than needed (difference between agent’s incentive and what is best for the firm). Inconsistent pricing by different sales reps—some give bigger discounts than others.
Practical Notes from HBR Common pricing/sales problems: Sales reps do not properly assess or understand customers’ needs (their demand). More background needed prior to their visits. Know your customers—the demanders. Sales reps insist on quick response from pricing analysts to finalize sale, leading to snap decisions (more mistakes). Sales reps also guaranteed prices to customers, forcing management to accept without review. Solutions: Better review & communications.