Water Demand Forecasting
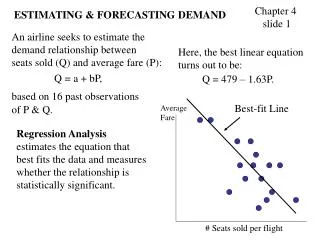
Water Demand Forecasting. SAD Water Supply Conference Wilmington, NC David Luckie (CESAM-PD) 251-690-2608. Completed & Ongoing Studies. Post Authorization Change Notification Report, Lake Lanier 1989 Carters and Allatoona Reallocations, 1991 ACT & ACF Comprehensive Studies, 1994-1996


Water Demand Forecasting
E N D
Presentation Transcript
Water Demand Forecasting SAD Water Supply Conference Wilmington, NC David Luckie (CESAM-PD) 251-690-2608
Completed & Ongoing Studies • Post Authorization Change Notification Report, Lake Lanier 1989 • Carters and Allatoona Reallocations, 1991 • ACT & ACF Comprehensive Studies, 1994-1996 • Black Warrior Headwaters Basin Section 22, Birmingham, AL, 1995-1996 • ACT & ACF Programmatic EIS’ 1998 • Choctawhatchee Pea & Yellow Rivers Basin Section 22, Southeastern Alabama, 2001 • Jackson County, MS Water Supply Project, 2002 • Okaloosa County, FL Section 22
Why do we care? • Project design issues • Contractual issues • Environmental impacts • Economics (NED & RED) • Financial impacts • Public Confidence
What is “Demand?” • Demand: The amount of water desired by an aggregate consumer base, given: • Price • Weather • Season • Time • Economic setting
The Gadget Box • IWR-MAIN - The Corps Standard • CorpsWater - Spreadsheet Model from Mobile • Your own models • The Rule of Thumb
IWR-MAIN • Experience • High degree of accuracy • Hungry! • Some knowledge of factors influencing water demand
CorpsWater • More uncertainty • Less flexibility • Easy to use • Relatively cheap • Not as data hungry
The Rule of Thumb • 150 gallons per person per day • 100 gallons per employee per week • Obviously cheap • Obvious issues on uncertainty
Which Tool? • Let Size and Complexity Decide • IWR-MAIN: • Watershed level studies • Cross state boundaries • CorpsWater/Spreadsheet Models: • Single utility • Small geographic area
IWR-MAIN Features • Disaggregation • Seasonal models • Indoor/Outdoor fractions • Sensitivity • Price Elasticity • Driven by housing stock & employment • Conservation Manager • Benefit/Cost Analysis • Actively developed & updated
Mobile District’s CorpsWater • Spreadsheet Model--Small, Easy, Quick • Seasonal Models • No Price Elasticity • No Indoor/Outdoor fractions • Not as sensitive • No Conservation Analysis • No Black Boxes! • Developed & updated as project funds permit
What We’re Good At • Residential Water Demand • Non-Residential Water Demand • Public-use Water Demand • Estimating Shortage Risk using other tools
What We’re NOT Good At • Thermal Power Generation • Agricultural Water Demand • Mining
You Need Data • Many variables affect water demand: • Population, housing, employment, income, weather, household size, water price, culture, lot size, growing season... • The key variables: • Housing units, employment, weather
Potential Data Sources • Census Bureau • Water Utilities • National Weather Service • US Geological Survey • State, Regional, Local Planning Agency • County Extension Agent
Seasonal Use Patterns • Summer Use vs. Winter Use • Less variability in non-residential sectors • Seasonal and Peak Use drive system design • Drought contingency • Conservation plans
Sectoral Use Patterns • Residential • Single family • Multifamily • Mobile Home • Non-Residential • Two Digit SIC (basic) • Custom Model
Unaccounted for Water Use • Water lost to theft, leakage, flushing and accidents • Firefighting • Un-metered public use • American Water Works Association target set to 10% of metered use
Basic Demand Forecasting • Collect & analyze historical use data • Prepare water demand model(s) • “Back-cast” history • Calibrate by altering intercept • Forecast future demand • Interpret and analyze results
Basic Demand Forecasting • Tips: • Use more than one growth scenario • Use AWWA Target of 10% Unaccounted • Forecast demand assuming it will be supplied
Advanced Demand Forecasting • Use IWR-MAIN • Survey users • End use coefficients • Indoor/Outdoor fractions • Seasonal use models • Calibrate by altering model coefficients
Conservation • Passive - Relatively cheap, voluntary measures to reduce consumption • Active - Expensive, coercive measures to reduce consumption
Conservation • Passive vs. Active Conservation: • Passive: • Education • Voluntary retrofit • System loss reduction • Active: • Price changes • Utility sponsored retrofit • Code changes
Conservation • Passive conservation measures rarely reduce aggregate demand • Active conservation measures often reduce aggregate demand, but not always
Pitfalls • Crude non-residential modeling • Schools, hospitals, prisons, golf courses • Vacation homes
Gee Whiz! • Tampa Florida has residential water use of about 63 gallons per customer day • Birmingham, AL: 251 gals/day • Dothan, AL: 289 gals/day • High Density multifamily housing will usually have the highest residential use rate. Why? • What device or appliance in the home uses the most water? • What nonresidential sector uses the most water per employee?