Demand Forecasting
Demand Forecasting. Demand Forecasting. Pivotal to operations demand management and PSI planning An unbelievable amount of information exists Multiple methods always deepen understanding … and lower risk. Precision is usually more apparent than real


Demand Forecasting
E N D
Presentation Transcript
Demand Forecasting • Pivotal to operations demand management and PSI planning • An unbelievable amount of information exists • Multiple methods always deepen understanding … and lower risk. • Precision is usually more apparent than real • Goal: get close and have contingency plans
Forecasting Approaches • Statistical analysisRegression, Time Series, etc. • Market research • Conceptual models • Expert judgment Complementary … not mutually exclusive
Qualitative Quantitative Judgment Numbers Qualitative Methods Quantitative Methods • Used when situation is vague & little data exist • New products • New technology • Intuition, experience • e.g., Internet sales • Used in stable situations when historical data exist • Existing products • Current technology • Math / stats techniques • e.g., color televisions
Demand Forecasting Judgment Numbers Qualitative Quantitative Disaggregate Model Bottom-up Top-down Roll-up Extrapolate
Demand Forecasting Judgment Numbers Qualitative Quantitative Disaggregate Model Bottom-up Top-down Roll-up Extrapolate
Top – Down Disaggregation Industry Category Product Item
Top – Down Disaggregation Industry Company Product Item
“Tyranny of 100” Share gains must come at the expense of specific competitors (who are very likely to retaliate) Which competitor(s)? Why? How?
Demand Forecasting Judgment Numbers Qualitative Quantitative Disaggregate Model Bottom-up Top-down Roll-up Extrapolate
Item Item Item Bottom-up Aggregation Customer 1 Customer 2 Customer 3 Item
Demand Forecasting Judgment Numbers Qualitative Quantitative Disaggregate Model Bottom-up Top-down Roll-up Extrapolate
Time Series Analysis 80 70 60 50 40 30 20 10 Actual Projected Penetration % 0 1 2 3 4 5 6 7 8 9 10 Years
80 70 60 50 40 30 20 10 New Product Penetration % Analogous Product 0 1 2 3 4 5 6 7 8 9 10 Years Time Series AnalysisAnalogous Products
Demand Forecasting Judgment Numbers Qualitative Quantitative Disaggregate Model Bottom-up Top-down Roll-up Extrapolate
Intent Translation Model ILLUSTRATIVE L TRANSLATION PROSPECTS PERCENT WEIGHTPROFILE BUYERS Definitely 9 0 % 1 0% 9% Probably 4 0 % 2 0% 8% Might or might not 10 % 2 0% 2% Probably not 0 1 5% 0 Definitely not 0 3 5% 0 19% Source: Thomas, p.206
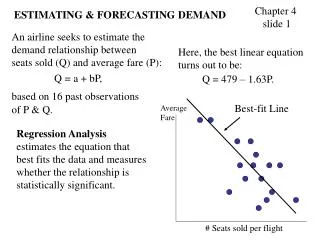
Linear Regression Model • Shows linear relationship between dependent & explanatory variables • Example: Diapers & # Babies (not time) Y-intercept Slope ^ Y = a + b X i i Dependent (response) variable Independent (explanatory) variable
Regression Issues • Illusory correlation • No cause and effect • Meaningless coefficients • Unexplainable variations
Sequential Factoring Total TV Households Cable Homes Wired For Cable Cable/ Baseball Population Baseball Fanatics Baseball Pay Per View Market Premium Service Buyers * A.K.A. “Factor Decomposition”, “Factor Analysis”
For example … How much dog food sold annually in the U.S.? Express answer in $$$$
Sequential FactoringHow much dog food? • How many people? • How many homes? • Homes with dogs? • Number of dogs per home? • Proportion of big & little dogs ? • Daily consumption ? (ounces) • Ounces per can ? • Price per can ?
How Much Dog Food ? Big Eats Little Eats Dog Food Big/little split # Big Dogs / Home Popul- ation # Little # Dogs Homes Homes w/ dogs People / House % Dogs
Demand ForecastingMarket Factoring MARKET POTENTIAL MARKET SIZE MARKET PENETRATION SALES MARKET SHARE
Market Forecasting Time Dimension
Keys to Success • Practical precision • Structured approach • Multiple methods • Iterative convergence
Demand ForecastingGeneral Principles • Errors are a certainty • Aggregate series most stable • Tendency to over-correct(especially short-run)
MARKET POTENTIAL MARKET SIZE MARKET PENETRATION SALES MARKET SHARE Demand Forecasting Market Disaggregation Time Series Analogies Regression Analysis Bottom-up Composites Majority Fallacy Diffusion Model Intent Translation A-T-RModel Cannibalization Effect ValueFunction Conjoint Analysis Tyrannyof 100