Demand Forecasting
3. Demand Forecasting. Slides prepared by Laurel Donaldson Douglas College. LO 1.


Demand Forecasting
E N D
Presentation Transcript
3 Demand Forecasting Slides prepared by Laurel Donaldson Douglas College
LO 1 Identify uses of demand forecasts, distinguish between forecasting time frames, describe common features of forecasts, list the elements of a good forecast and steps of forecasting process, and contrast different forecasting approaches. Describe at least three judgmental forecasting methods. Describe the components of a time series model, and explain averaging techniques and solve typical problems. Describe trend forecasting and solve typical problems. Describe seasonality forecasting and solve typical problems. Describe associative models and solve typical problems. Describe three measures of forecast accuracy, and two ways of controlling forecasts, and solve typical problems. Identify the major factors to consider when choosing a forecasting technique. LO 2 LO 3 LO 4 LO 5 LO 6 LO 7 LO 8
What is forecasting? • Features common to all forecasts • Elements of a good forecast • Steps in the forecasting process • Approaches to forecasting • Judgmental methods • Time series models • Associative models • Accuracy and control of forecasts • Choosing a forecasting technique • Excel Templates
I see that you willget a 100 in OM this semester. What is Forecasting? Ademand forecastis an estimate of demand expected over a future time period
How big a facility do I need to manufacture a new videophone? • How much money do I need to run operations of my accounting office? • How many pairs of white shoes should I order for the summer season in my store? • How many operators should I schedule next month for my call centre? • How much lettuce should I buy for next week in my restaurant? Need to FORECAST demand!
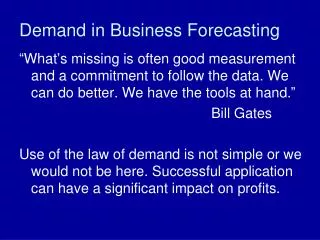
Features of Forecasts • Assumes causal systempast ==> future • Forecasts rarely perfect because of randomness • Forecasts more accurate forgroups vs. individuals • Forecast accuracy decreases as time horizon increases
Approaches to Forecasting • Judgmental • non-quantitative analysis of subjective inputs • considers “soft” information such as • human factors, experience, gut instinct • Quantitative • Time series models • extends historical patterns of numerical data • Associative models • create equations with explanatory variables to predict the future
Judgmental Methods • Executive opinions • pool opinions of high-level executives • long term strategic or new product development • Expert opinions • Delphi method: iterative questionnaires circulated until consensus is reached. • technological forecasting
Judgmental Methods • Sales force opinions • based on direct customer contact • Consumer surveys • questionnaires or focus groups • Historical analogies • use demand for a similar product
Level: (average) horizontal pattern Trend: steady upward or downward movement Seasonality: regular variations related to time of year or day Cycles: wavelike variations lasting more than one year Irregularvariations: caused by unusual circumstances, not reflective of typical behaviour Randomvariations: residual variations after all other behaviours are accounted for (called noise) What is a Time Series? Time series: a time ordered sequence of observations taken at regular intervals of time The following 6 patterns could be identified in a time series:
Patterns of a Time Series Seasonal peaks (winters) Trend component Actual demand line Demand for snowboards Random variation Year 2 Year 3 Year 4 Year 1
Time series models • Naive methods • Averaging methods • Moving average • Weighted moving average • Exponential smoothing • Trend models • Linear and non-linear trend • Trend adjusted exponential smoothing • Techniques for seasonality • Techniques for cycles
Naive Methods • Next period = last period • Simple to use and understand • Very low cost • Low accuracy F = forecast A = actual
Uh, give me a minute.... We sold 250 wheels last week.... Now, next week we should sell.... Naive Method - Example
2 years ago we sold 50 memberships. Last year we sold 75 memberships. This year we expect to sell … Naive Method with Trend: Example 100
Averaging Methods F = forecast A = actual = smoothing constant
Moving Average • average of last few actual data values, updated each period • easy to calculate and understand • smoothes bumps, lags behind changes • choose number of periods to include • fewer data points = more sensitive to changes • more data points = smoother, less responsive
Moving Average - Example • Compute a three-period moving average forecast for period 6, given the demand below
Weighted Moving Average - Example • Compute a 4-period weighted moving average forecast for period 6 using a weight of 0.4 for the most recent period, 0.3 for the next, 0.2 for the next, and 0.1 for the next. • The choice of weights may involve the use of trial and error to find a suitable weighting scheme • Weights must add up to 100%
Period Demand Forecast 1 9 2 12 3 14 4 16 5 19 6 23 7 26 9 12 14 (9 + 12 + 14)/3 = 11 2/3 Moving Average Example (12 + 14 + 16)/3 = 14 (14 + 16 + 19)/3 = 16 1/3 (16 + 19 + 23)/3 = 19 1/3
Moving Average Forecast 30 – 28 – 26 – 24 – 22 – 20 – 18 – 16 – 14 – 12 – 10 – Actual Sales Quantity | | | | | | | | | | | | 1 2 3 4 5 6 7 8 9 10 11 12 Graph of Moving Average
Period Demand Forecast 1 9 2 12 3 14 4 16 5 19 6 23 7 26 9 12 14 [(.5 x 14) + (.3 x 12) + (.2 x 9)] = 12.4 Moving Average Example Apply weights of .5 for most recent period, then .3, then .2 [(.5 x 16) + (.3 x 14) + (.2 x 12)] = 14.6 [(.5 x 19) + (.3 x 16) + (.2 x 14)] = 17.1 [(.5 x 23) + (.3 x 19) + (.2 x16)] = 20.4
Weighted moving average 30 – 25 – 20 – 15 – 10 – 5 – Actual sales Quantity Moving average | | | | | | | | | | | | 1 2 3 4 5 6 7 8 9 10 11 12 Moving Average And Weighted Moving Average
Exponential Smoothing • sophisticated weighted moving average • weights decline exponentially • most recent data weighted most • subjectively choose smoothing constant • ranges from 0 to 1 (commonly .05 to .5) • widely used • easy to use • easy to alter weighting
Exponential Smoothing Formula • Forecast = previous forecast plus a percentage of the forecast error • Actual - Forecast is the error term • is the % feedback Ft = Ft-1 + (At-1 - Ft-1) F = forecast A = actual
Exponential Smoothing: Alternate Formula • Forecast = previous forecast plus a percentage of the forecast error • is the weight on actual demand • (1 -) is the weight on previous forecast Ft = (1 - )Ft-1 + (At-1) F = forecast A = actual
Exponential Smoothing: Example • Forecasted demand = 142 video games • Actual demand = 153 • Smoothing constant = .20 New forecast= .2 (153) + (1 - .2)(142) = 30.6 + 113.6 = 144.2 ≈ 144 games
Exponential Smoothing: Example • Forecasted demand = 142 video games • Actual demand = 153 • Smoothing constant = .20 New forecast= 142 + .2 (153 - 142) = 30.6 + 113.6 = 144.2 ≈ 144 games
Exponential Smoothing: Example • Prepare a forecast using smoothing constant = 0.40. • What is the starting point? • average of several periods of actual data • subjective estimate (for this example, use 60) • first actual value (naïve approach)
Exponential Smoothing: Your Turn! • What are the exponential smoothing forecasts for periods 2-5 using =0.5? • Use naïve approach for 1st week
F2=(.5)(820)+(1 - .5)(820) =820 F3=(.5)(775)+(1 - 0.5)(820)=797.5 Exponential Smoothing: Your Turn!
225 – 200 – 175 – 150 – Actual demand a = .5 Demand a = .1 | | | | | | | | | 1 2 3 4 5 6 7 8 9 Period Selecting a Smoothing Constant
Choosing • When demand is fairly stable, use a lower value for • smoothes out random fluctuations • When demand increasing or decreasing, use a higher value for • more responsive to real changes • Try to find balance • trial and error • can change over time.
True or False? A moving average forecast tends to be more responsive to changes in the data series when more data points are included in the average. False As compared to a simple moving average, the weighted moving average is more reflective of the recent changes. True A smoothing constant of .1 will cause an exponential smoothing forecast to react more quickly to a sudden change than a value of .3 will. False
Excel: Exponential Smoothing Solved Problem 1: Excel Template
Techniques for Trend • Develop an equation that describes the trend • Look at historical data
Linear Trend Equation • Fit a trend line to a series of historical data • Use regression to find the equation of the line (called the Least Squares Line)
Actual observation Deviation Demand Deviation Deviation Deviation Deviation Deviation Points on the line Deviation Time Linear Trend
Excel - Linear Trend Or Insert Functions: =SLOPE(Range of y's,Range of x's) =INTERCEPT(Range of y's,Range of x's)
Trend-Adjusted Exponential Smoothing • select values (usually through trial and error) for • a = smoothing constant for average • b = smoothing constant for trend • estimate starting smoothed average and smoothed trend • use most recent data
Trend-Adjusted Exponential Smoothing TAFt+1 = St+ Tt (3–6) St = TAFt+α(At TAFt) (3–7) Tt = Tt-1 + (St St-1 Tt-1) where St= smoothed average at the end of period t Tt= smoothed trend at the end of period t
Techniques for Seasonality • Additive or Multiplicative Model • quantity added to average or trend • or proportion x average or trend Additive Model Demand = Trend + Seasonality Demand Multiplicative Model Demand = Trend x Seasonality time
Using Seasonal Relatives • Seasonal Relative (or index) • = proportion of average or trend for a season in the multiplicative model • seasonal relative of 1.2 = 20% above average • Deseasonalize • remove seasonal component to more clearly see other components • divide by seasonal relative • Reseasonalize • adjust the forecast for seasonal component • multiply by seasonal relative