Colour coding, KPIs and the Road to Damascus
210 likes | 427 Vues
Colour coding, KPIs and the Road to Damascus. Shedding new light on reporting the student experience at the University of Sydney Rachel Y. Symons Quality Assurance Officer (Learning and Teaching). “We can learn from experience if we are ready to adapt that experience to changed conditions”

Colour coding, KPIs and the Road to Damascus
E N D
Presentation Transcript
Colour coding, KPIs and the Road to Damascus Shedding new light on reporting the student experience at the University of Sydney Rachel Y. Symons Quality Assurance Officer (Learning and Teaching)
“We can learn from experience if we are ready to adapt that experience to changed conditions” JC Masterton (1972): The Double Cross System in the war of 1939-1945
Scene setting • Reports Marks 1 & 2 • Colour coding • Taxonomy upgrade • NVivo7 • Reports Mark 3 • What next?
Reports Mark One (2003 – 2006) • Areas of best practice • Suggested improvements • Ordered by percentage of comments received • Not linked to SCEQ scales • Redundant with introduction of KPIs
Reports Mark Two (2007) • Aligned with KPIs • Generic Skills • Good Teaching • Overall Satisfaction • List of key issues • Minimal sample comments • Results as raw numbers • Undergraduate and postgraduate coursework combined on one page
Feedback and A new broom • Dense • Not user friendly • Difficult to interpret • Percentages not raw numbers • Confusing to novice • Need for succession planning
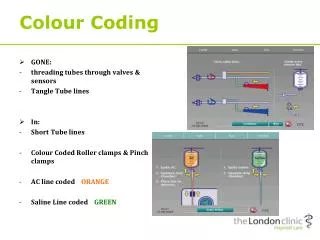
Colour coding and KPIs • Easy identification of related data across all documentation • Taxonomy • Recording analysis • Communicating information • Linked to KPIs / SCEQ scales
Taxonomy enrichment • Describes the concepts • Coverage of each component • Answers the question • Illustrates with student comments
The Road to Damascus • NVivo7 + Boolean logic = technological conversion • Combines manual and automated analysis • Use of pre-set base queries • Faculty customisation
Benefits of NVivo7 methodology • No need to print source documents • Simultaneous coding • Time saving • Direct transfer of comments into reports • Reduces impact on environment
Revitalising the reports • Consultation with stakeholders and communications experts • Developed quality product • Beneficial to all stakeholders • More actionable than previous reports
Reports Mark Three (2008) • KPI alignment • SCEQ and CEQ data • Executive summary • Trends • Comparative quantitative and qualitative data (2001 – 2007) • Key issues (2007) • Customisation by faculty • Separate reports undergraduate and postgraduate coursework
Reports Mark Three (2008) Key results • Faculty scores for Good Teaching (KPI 15; Section 2) • have increased by 8% since 2005 for current students (SCEQ) • have been consistently above the University average for current students (SCEQ) since 2000 • are lower than previous years for graduates (CEQ) • are lower than the University average for graduates (CEQ) • domestic and international students are recording similar experiences • Analysis of the qualitative data from current students (SCEQ) indicates that experiences of teaching within the Faculty are evenly divided between students who consider this to be one of the best areas of their experience and those who suggested improvements. For graduates (CEQ), a higher percentage of comments received from respondents focused on areas of improvement rather than areas of best practice.
Have we succeeded? • Improved arrangement • Easy identification of areas • colour coding • collation by KPI • Used to inform • curriculum review • marketing • Aids in prioritising areas for improvement • Incorporation of qualitative and quantitative data plus executive summary particularly helpful
What next? • Investigate strategies for “closing the loop” • Report on faculty/ student administration • Cross university reports • eLearning • Research-enhanced learning and teaching • Library • International students • Alignment with AUSSE Scales and survey items
What next? • Commitment to quality improvement • Reports continue to be actionable and accessible • Taxonomy continuous w-i-p • Flexibility of NVivo7 will accommodate range of analytical reports
“We can learn from experience if we are ready to adapt that experience to changed conditions”
Useful information • Taxonomy; methodology; reportshttp://www.usyd.edu.au/learning/evaluating/open_ended_responses.shtml • Contact information r.symons@usyd.edu.au 02 9351 6560