Download
1 / 5
50 likes | 194 Vues
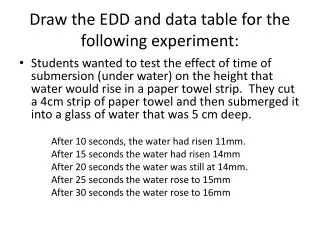
This experiment investigates the relationship between the time a paper towel strip is submerged in water and the height to which the water rises within the towel. A 4 cm strip of paper towel was submerged in a 5 cm deep glass of water, and measurements of water rise were taken at intervals from 10 to 30 seconds. The students hypothesized that longer submersion time would result in a greater height of water rise. This data will be represented using an experimental design diagram (EDD) and a data table for clarity in analysis.

E N D
Draw the EDD and data table for the following experiment: • Students wanted to test the effect of time of submersion (under water) on the height that water would rise in a paper towel strip. They cut a 4cm strip of paper towel and then submerged it into a glass of water that was 5 cm deep. After 10 seconds, the water had risen 11mm. After 15 seconds the water had risen 14mm After 20 seconds the water was still at 14mm. After 25 seconds the water rose to 15mm After 30 seconds the water rose to 16mm
EDD • Title: The effect of the submersion time on the height of the water • Hypothesis: If the submersion time is longer, then the height the water rises will be higher. • IV: Submersion Time (sec) • Levels – • DV: Height water rose (mm) • Constants – paper towel, size of strip, glass of water
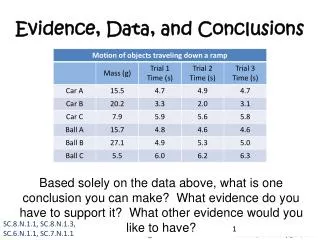
Questions • What is the graph missing?? • Where does the IV go? • Where does the DV go?? • How to determine the interval for the x and y axis?? It must remain even for the graph to be an accurate representation of the data! • Take the high #- low # = range • Range/# of squares = interval