Download
1 / 48
480 likes | 640 Vues
A Novel Method for Signal Transduction Network Inference from Indirect Experimental Evidence Bhaskar DasGupta Department of Computer Science University of Illinois at Chicago Chicago, IL 60607-7053 dasgupta@cs.uic.edu. Acknowledgements

E N D
A Novel Method for Signal Transduction Network Inference from Indirect Experimental Evidence Bhaskar DasGupta Department of Computer Science University of Illinois at Chicago Chicago, IL 60607-7053 dasgupta@cs.uic.edu University of Illinois at Chicago
Acknowledgements Collaborators: Piotr Berman (Penn State, CS) Rèka Albert (Penn State, Physics and Biology) Riccardo Dondi (Università degli Studi di Bergamo, Italy, CS) Sema Kachalo (UIC, Bioengineering) Eduardo Sontag (Rutgers, Mathematics) Kelly Westbrook (Georgia State, CS) Alexander Zelikovsky (Georgia State, CS) Ranran Zhang (Penn State, Biology) Grants: (NSF) IIS-0346973, DBI-0543365 (current) CCR-0208749, CCR-0206795 (past) University of Illinois at Chicago
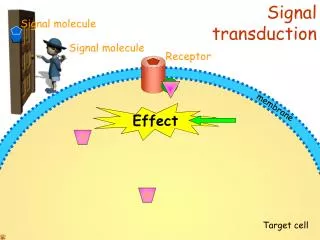
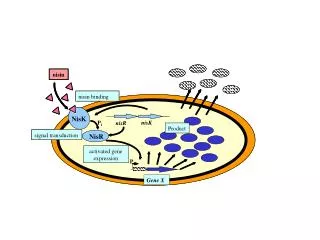
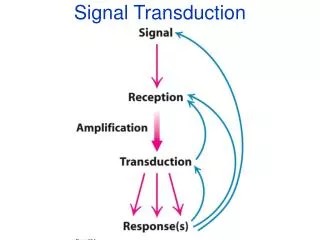
Signal Transduction Networks Cell: complex interactions between its numerous constituents such as DNA, RNA, proteins and small molecules. Cells use signaling pathways and regulatory mechanisms to coordinate multiple functions, allowing them to respond to and acclimate to an ever-changing environment. Genome-wide experimental methods now identify interactions among thousands of proteins University of Illinois at Chicago
Simplified picture of overall goal (more details to follow...) A→B C→(D ┤E) . . ● fast ● ?? ● ● minimal complexity biologically relevant direct and double-causal experimental evidence network University of Illinois at Chicago
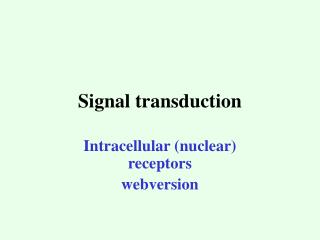
Nature of experimental evidence • biochemical (e.g., enzymatic activity, protein-protein interaction) • direct interaction • pharmacological evidence • not direct interaction • genetic evidence of differential responses to a stimulus • can be direct, but most often double-causal University of Illinois at Chicago
We describe a method for synthesizing double-causal (path-level) information into a consistent network Our method significantly expands the capability for incorporating indirect (pathway-level) information. Previous methods of synthesizing signal transduction networks only include direct biochemical interactions, and are therefore restricted by the incompleteness of the experimental knowledge on pairwise interactions. University of Illinois at Chicago
Informal graph-theoretic translation Direct interaction A promotes B or AB ........................ AB A inhibits B or A┤B ........................ AB Indirect interactions (just one illustration) C promotes the process through which A promotes B is often represented in the form 0 1 pseudo-vertex A B C University of Illinois at Chicago
Two necessary problems for network synthesis • Pseudo-vertex collapse (PVC) ---- can be solved in poly time • Binary transitive reduction (BTR) --- NP-complete University of Illinois at Chicago
Some notations/terminologies.... • Graph G=(V,E) is by default a directed weighted graph • All edge weights are from {0,1} • Weight of a path is the sum of edge weights modulo 2 • u x v denotes path from u to v of weight x • A subset of edges marked as “critical” (known direct interactions) 0 activation 1 inhibition University of Illinois at Chicago
Pseudo-vertex collapse (PVC) Intuitively, the PVC problem is useful for reducing the pseudo-vertex set to the the minimal set that maintains the graph consistent with all indirect experimental observations. pseudo-vertices u out(u)=out(v) in(u)=in(v) v new psuedo-vertex uv University of Illinois at Chicago
Pseudo-vertex collapse (PVC), formally.... Input: graph G=(V,E), a subset V’ V of “pseudo” vertices, rest “real” vertices Definition: for any vertex v, in(v) = { (u,x) | u x v, x{0,1} } out(v) = { (u,x) | v x u, x{0,1} } collapsing two vertices u and v permissible provided • both are not real vertices • in(u)=in(v) and out(u)=out(v) If permissible, the collapse of two vertices u and v creates a new vertex w, makes every incoming (resp. outgoing) edges to (resp. from) either u or v an incoming (resp. outgoing) edge from w, removes any parallel edge that may result from the collapse operation and also removes both vertices u and v. Valid solution: graph G”=(V”,E”) obtained from G by a sequence of permissible collapse operations Goal: minimize |E”| University of Illinois at Chicago
critical edge remove? no (critical edge) A simplistic illustration of BTR (all activation edges) remove? yes (not critical and alternate path) Intuitively, the BTR problem is useful for determining the sparsest graph consistent with a set of experimental observations University of Illinois at Chicago
Binary Transitive Reduction (BTR), formally.... Input: • graph G=(V,E) • A subset Ec E of edges marked as “critical” Valid solution: a subset of edges E’E that maintains same “reachability”: u x v in G=(V,E) if and only if u x v in G’=(V,E’) Goal: minimize |E’| University of Illinois at Chicago
Some biologists did look at very simplified or somewhat different version of BTR, e.g.: • A. Wagner, Estimating Coarse Gene Network Structure from Large-Scale Gene Perturbation Data, Genome Research, 12, pp. 309-315, 2002 • too special (reachability only), no efficient algorithms reported • T. Chen, V. Filkov and S. Skiena, Identifying Gene Regulatory Networks from Experimental Data, Third Annual International Conference on Computational Moledular Biology, pp. 94-103, 1999 • “excess edge deletion” problem, biologically too restrictive version See the following excellent survey for more comprehensive information about biological network inference and modeling: • V. Filkov, Identifying Gene Regulatory Networks from Gene Expression Data, in Handbook of Computational Molecular Biology (edited by S. Aluru), Chapman & Hall/CRC Press, 2005 • H. D. Jong, Modelling and Simulation of Genetic Regulatory Systems: A Literature Review, Journal of Computational Biology, Volume 9, Number 1, pp. 67-103, 2002 University of Illinois at Chicago
BTR is used here Very high level and vague description of the entire network synthesis process Synthesize direct interactions Update on new experimental data if needed Optimize Synthesize indirect interactions Optimize PVC is used here University of Illinois at Chicago
excitory (inhibitory) connection encoded by edge label 0 (1) • [encode single causal relationships] 1.1 Build networks for connections like A→B and A┤B noting each critical edge. 1.2 Apply BTR • [encode double causal reltionships] 2.1 For each double causal relationship of the form A → (B → C) with x,y{0,1}, add new nodes and/or edges as follows: • if B → C Ecritical then add A → (B → C) • if no subgraph of the form (for some node D with b = a+b = y (mod 2) ) then add the subgraph (where P is a new pseudo-node and b = a+b = y (mod 2) ) 2.2 Apply PVC • [final reduction] Apply BTR y x y y x A x a b B D C A x a b P C B University of Illinois at Chicago
All the steps in the network synthesis procedure except the steps that involve BTR can be solved exactly in polynomial time. Thus, it behooves to look at BTR more closely. University of Illinois at Chicago
But, before that, biological validation of the network synthesis approach is desirable Need a network that uses double-causal experimental evidence..... University of Illinois at Chicago
Here is one such network (plant signal transduction network)..... consistent guard cell signal transduction network for ABA-induced stomatal closure • manually curated • described in S. Li, S. M. Assmann and R. Albert, Predicting Essential Components of Signal Transduction Networks: A Dynamic Model of Guard Cell Abscisic Acid Signaling, PLoS Biology, 4(10), October 2006 • list of experimentally observed causal relationships collected by Li et al. and published as Table S1. This table contains • around 140 interactions and causal inferences, both of type “A promotes B” and “C promotes process (A promotes B)” • We augment this list with critical edges drawn from biophysical/biochemical knowledge on enzymatic reactions and ion flows and with simplifying hypotheses made by Li et al. both described in Text of S1 University of Illinois at Chicago
Arabidopsis thaliana is a small flowering plant that is widely used as a model organism in plant biology. Arabidopsis is a member of the mustard (Brassicaceae) family, which includes cultivated species such as cabbage and radish. Arabidopsis is not of major agronomic significance, but it offers important advantages for basic research in genetics and molecular biology (source: http://www.arabidopsis.org/portals/education/aboutarabidopsis.jsp) University of Illinois at Chicago
Regulatory interactions between ABA signal transduction pathway components University of Illinois at Chicago
Regulatory interactions between ABA signal transduction pathway components (continued) ERA1 ┤(ABA → CalM) NO→ GC not critical and not enzymatic University of Illinois at Chicago
Some nodes in the network GCR1 putative G protein coupled receptor OST1 protein NO Nitric Oxide ABH1 RNA cap-binding protein RAC1 small GTPase protein … University of Illinois at Chicago
(left)Guard cell signal transduction network for ABA-induced stomatal closure manually curated by Li, Assmann and Albert [source: PloS Biology, 10 (4), 2006]. Most of the information is derived from the model species Arabidopsis thaliana. ( right) our developed automated network synthesis procedure produced a reduced (fewer edges) network while preserving all observed pathways [source: DasGupta’s group, Journal of Computational Biology and Bioinformatics] University of Illinois at Chicago
Summary of comparison of the two networks • Li et al. has 54 vertices and 92 edges our network has 57 vertices but 84 edges • Both networks have identical strongly connected component of vertices • All the paths present in the Li et al.’s reconstruction are present in our network as well • The two networks have 71 common edges • It took a few seconds to synthesize our network University of Illinois at Chicago
Software is available at: http://www.cs.uic.edu/~dasgupta/network-synthesis/ • runs on any machine with MS Windows (Win32) • click, save the executable and run • for linux/unix fans, source files for a non-graphic version of the program, that can be compiled and run from the console, can be obtained by sending an email to the authors University of Illinois at Chicago
Other applications of the software Synthesizing a Network for T Cell Survival and Death in Large Granular Lymphocyte Leukemia • Large Granular Lymphocytes (LGL) are medium to large size cells with eccentric nuclei and abundant cytoplasm. • LGL leukemia was initially described as a disordered clonal expansion of LGL and their invasions in the marrow, spleen and liver. University of Illinois at Chicago
Synthesizing a Network for T Cell Survival and Death in Large Granular Lymphocyte Leukemia • Synthesized a cell-survival/cell-death regulation-related signaling network from the TRANSPATH 6.0 database, with additional information manually curated from literature search. • 359 vertices of this network represent proteins/protein families and mRNAs participating in pro-survival and Fas-induced apoptosis pathways. • 1295 edges represent regulatory relationships between nodes, including protein interactions, catalytic reactions, transcriptional regulation • Performing BTR with NET-SYNTHESIS reduced the total edge-number to 873 • ...... ongoing work University of Illinois at Chicago
Data sources Signal transduction pathway repositories such as • TRANSPATH (http://www.gene-regulation.com/pub/databases.html#transpath) • protein interaction databases such as the Search Tool for the Retrieval of Interacting Proteins (http://string.embl.de) contain up to thousands of interactions, a large number of which are not supported by direct physical evidence. NET-SYNTHESIS can be used to filter redundant information while keeping all direct interactions. University of Illinois at Chicago
Performance of our BTR algorithm on simulated signal transduction networks But, what is a random biological network? University of Illinois at Chicago
Biological networks are reported to be scale-free: e.g., N. Guelzim, S. Bottani, P. Bourgine, and F. Kepes, Topological and causal structure of the yeast transcriptional regulatory network, Nature Genet.31, 60–63, 2002. But, such claims are disputed in: R. Khanin and E. Wit, How Scale-Free Are Biological Networks, Journal of Computational Biology,Vol. 13, No. 3 : 810 -818, 2006. University of Illinois at Chicago
Based on the available information on topological properties of signal transduction networks, we selected following parameters for random signal transduction nets: • distribution of in-degree of the network is exponential: Pr[in-degree=x]=L e-Lx, ½ ≤ L ≤ ⅓, maximum in-degree is 12 • distribution of out-degree is governed by a power-law: x ≥ 1 : Pr[out-degree=x]=cx-c; Pr[out-degree=0] ≥ c, 2 < c < 3 maximum out-degree is 200 • varied the ratio of excitory to inhibitory edges between 2 and 4 University of Illinois at Chicago
Critical edges? No known accurate estimates of percentage of total edges that are critical are available: • the curated network of Ma'ayan et al. (Science, 2005) is expected to have close to 100% critical edges as they specifically focused on collecting direct interactions only. • Protein interaction networks are expected to be mostly critical (Giot et al., Science, 2003; Han et al., Nature, 2004; Li et al., Science, 2004) • The so-called genetic interactions (e.g., synthetic lethal interactions) represent compensatory relationships, and only a minority of them are direct interactions. • Network inference (reverse engineering) approaches lead to networks whose interactions are close to 0% critical We tried a few small and large values, such as 1%, 2% and 50%, for the percentage of edges that are critical to catch qualitatively all regions of dynamics of the network that are of interest. University of Illinois at Chicago
Tested on about 550 random networks • # of vertices in the range of about 100 to 1000 • running time for individual networks: seconds to at most a minute • To verify the robustness of performance of our BTR algorithm we perturb most of these networks with increasing amounts of additional random edges chosen such they do not change the optimal solution of the original graph. Almost always the solution quality does not change because of this. University of Illinois at Chicago
To generate random graphs with prescribed degree distributions, we use the procedure described in the following paper: M. E. J. Newman, S. H. Strogatz and D. J. Watts. Random graphs with arbitrary degree distributions and their applications, Phys. Rev. E, 64 (2), pp. 026118-026134, July 2001 University of Illinois at Chicago
Performance of our implemented algorithm for BTR on simulated networks A plot of the empirical performance of our BTR algorithm on the 561 simulated interaction networks. E' is our solution, OPT is a lower bound on the minimum number of edges and 100( (|E'|/OPT)-1) is the percentage of additional edges that our algorithm keeps. On an average, we use about 5.5% more edges than the trivial bound on the optimum (with about 4.8% as the standard deviation) University of Illinois at Chicago
Now comes all the theory that helped us to design efficient algorithms for BTR University of Illinois at Chicago
Some biologists did look at very simplified or somewhat different version of BTR, e.g.: • A. Wagner, Estimating Coarse Gene Network Structure from Large-Scale Gene Perturbation Data, Genome Research, 12, pp. 309-315, 2002 • too special (reachability only), no efficient algorithms • T. Chen, V. Filkov and S. Skiena, Identifying Gene Regulatory Networks from Experimental Data, Third Annual International Conference on Computational Moledular Biology, pp. 94-103, 1999 • “excess edge deletion” problem, biologically too restrictive version See the following excellent survey for more comprehensive information about biological network inference and modeling: • V. Filkov, Identifying Gene Regulatory Networks from Gene Expression Data, in Handbook of Computational Molecular Biology (edited by S. Aluru), Chapman & Hall/CRC Press, 2005 • H. D. Jong, Modelling and Simulation of Genetic Regulatory Systems: A Literature Review, Journal of Computational Biology, Volume 9, Number 1, pp. 67-103, 2002 University of Illinois at Chicago
But theoretical computer science community (and computer network community) has looked at versions of BTR from as early as 1972. For example...... University of Illinois at Chicago
Minimum Equivalent digraph (MED) problem (special case of BTR, but very useful) • MED for acyclic graphs can be solved exactly in linear time • A. Aho, M. R. Garey and J. D. Ullman, The transitive reduction of a directed graph, SIAM Journal of Computing, 1 (2), pp. 131-137, 1972 • In general NP-hard, in fact a little bit harder (MAX-SNP-hard) if larger cycles are present, but..... • Poly-time if all cycles are of length 4 • 2-approximation is easy • 1.617+-approximation is possible for any constant 0 • recently 1.5-approximation was provided • G. N. Frederickson and J. JàJà, Approximation algorithms for several graph augmentation problems, SIAM Journal of Computing, 10 (2), pp. 270-283, 1981 • S. Khuller, B. Raghavachari and N. Young, Approximating the minimum equivalent digraph, SIAM Journal of Computing, 24 (4), pp. 859-872, 1995 • S. Khuller, B. Raghavachari and N. Young, On strongly connected digraphs with bounded cycle length, Discrete Applied Mathematics, 69 (3), pp. 281-289, 1996 • A. Vetta, Approximating the minimum strongly connected subgraph via a matching lower bound,12th ACM-SIAM Symposium on Discrete Algorithms, pp. 417-426, 2001 University of Illinois at Chicago
Weighted version of MED (less special case of BTR, and again very useful) • at least as difficult as MED (obviously) • 2-approximation is known • G. N. Frederickson and J. JàJà, Approximation algorithms for several graph augmentation problems, SIAM Journal of Computing, 10 (2), pp. 270-283, 1981 • S. Khuller, B. Raghavachari and A. Zhu, A uniform framework for approximating weighted connectivity problems, 19th Annual ACM-SIAM Symposium on Discrete Algorithms, pp. 937-938, 1999 University of Illinois at Chicago
Why did these computer scientists look at these problems? • connectivity/robustness issues of computer networks What kind of algorithmic methodologies did they use? • “cycle contraction” technique • “directed spanning arborescence” approach • “matching lower bound” method • potential method … University of Illinois at Chicago
But, why should we know about all this??? University of Illinois at Chicago
Our theoretical results build upon these previous works in a non-trivial manner: • BTRcan be solved exactly in polynomial time if the graph has all cycles are of length 3 • BTRcan be 2-approximated … University of Illinois at Chicago
But, again, why should we know about the theory??? University of Illinois at Chicago
Our algorithms in the software used the theory (and, specifically, some details of complicated proofs in the theory) University of Illinois at Chicago
Thank you for your attention! Questions? Comments? Please write to: dasgupta@cs.uic.edu or visit http://www.cs.uic.edu/~dasgupta University of Illinois at Chicago