Understanding Exponential Functions: Growth, Decay, and Graphing Techniques
This resource covers the key elements of exponential functions, including their continuous and one-to-one nature, as well as their domain and range. It explains the characteristics of graphs reflecting exponential growth (with b > 1) and decay (with 0 < b < 1). Readers will learn to identify y-intercepts, horizontal asymptotes, and how to sketch graphs based on given points. Examples are provided to illustrate the process of determining whether a function represents growth or decay and how to formulate exponential functions from specific coordinates.

Understanding Exponential Functions: Growth, Decay, and Graphing Techniques
E N D
Presentation Transcript
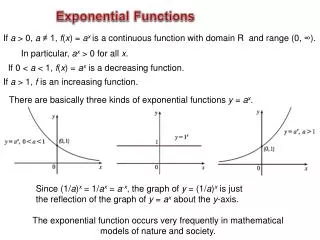
The equation of an exponential function: • The function is continuous and one-to-one • domain: set of real numbers. • range: • If a > 0: all positive numbers • If a < 0: all negative numbers • horizontal asymptote: x-axis • The graph contains the point (0, a), where a is the y-intercept. • 5. The graphs of are reflections across the y-axis.
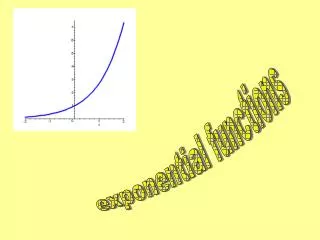
Exponential Growth & Decay • If b>1, the function represents exponentialgrowth. • If0<b<1, the function represents exponential decay.
Sketch the graph of . Then state the function’s domain and range. Example 1-1a Example 1 x –2 –1 0 1 2
Example 1-1a Example 2 Sketch and find the domain and range. x –2 –1 0 1 2
Determine whether each function represents exponential growth or decay. a. b. c. d. Example 1-2d Example 3
Example 4 Write an exponential function whose graph passes through the points (0,3) and (1,15)
Example 5 Write an exponential function whose graph passes through the given points: (0,-5) and (-3,-135)
Simplify . Simplify . Example 1-4a Example 6
Solve . Solve . Example 1-5a Example 7
Solve each equation. Example 1-5d Example 8