Download
1 / 20
200 likes | 330 Vues
A Richer Understanding of Bayesian Network Diagrams Dr. Kamaran Fathulla University of Essex International Academy kamaran@essex.ac.uk June 2011. Some 2500 years ago people have used clay tablets to express boundaries, groupings, and routes.

E N D
A Richer Understanding of Bayesian Network Diagrams Dr. KamaranFathulla University of Essex International Academy kamaran@essex.ac.uk June 2011
Some 2500 years ago people have used clay tablets to express boundaries, groupings, and routes Clay Tablet map from Ga-Sur, Kirkuk, 2,500 B.C.
Diagrams are everywhere Applied psychology Cognitive science Linguistics Visual programming Data visualisation Graphic design Education History and philosophy of science Architecture Blackwell and Engelhardt (1999) Eppler, 2003
But.... Diagrams continue to be difficult to understand and work with There has been a substantial growth in the use of diagrams in earlier stages of the research process to collect data. Despite this growth, guidance on this technique is often isolated within disciplines. Numerous references are cited on people expressing difficulty or discomfort with diagramming. Muriah J Umoquit, et al (2011) A multidisciplinary systematic review of the use of diagrams as a means of collecting data from research subjects: application, benefits and recommendations
Sources of the difficulties 1. Diversity of types of diagrams Boxes and lines Contour maps Bar charts etc.. 2. Diversity of types of change (dynamics) Different types of diagrams require different editing operations Different diagram types have different rules of well formedness Need to relax these rules but maintain well formedness 3. All of the above in semantically mixed diagrams Even single type diagrams have mixed semantics Next..... Bayesian type diagrams
Influence Diagrams ID First introduced in the mid 70s. ID’s have become a de facto standard for representation of Bayesian decision problems. There is not too much feedback from analysts and experts about their experiences using IDs for building decision-making models. Constructing ID is considered as an art. An Influence Diagram Concha Bielza, Manuel Gómez, Prakash P. Shenoy (2009) Modeling Challenges with Influence Diagrams: Representation Issues SCHOOL OF BUSINESS WORKING PAPER NO. 319
On the difficulty of Bayesian Network Diagrams BND Misconceptions: No order misconception: Failure to understand that paths are ordered (e. g., commits CYB). LAN-as-path misconception: Failure to see that a path through a LAN visits intervening nodes in sequence, like a physical path (e.g., commits YRBMC) Omit bridge misconception/error: Failure to recognize or list a true bridge node (e.g., commits BC or omits BMC) Commit bridge misconception/error: Inferring a nonexistent bridge node, or selectively committing the LAN-as-path error (e.g., commits YRB) Reading-order misconception/bias: Listing only forward paths (misconception); or omitting backwards paths more often (bias) Generate all possible shortest paths of information flow for Network 1 and Network 2 James E. Corter et al (2009) Bugs and Biases: Diagnosing Misconceptions in the Understanding of Diagrams. Proceedings of the 31st Annual Conference of the Cognitive Science Society It has been argued that Bayesian reasoning is counterintuitive. People do not employ Bayesian reasoning intuitively, find it very difficult to learn Bayesian reasoning when tutored, and rapidly forget Bayesian methods once the tutoring is over. This limitation seems to hold equally true for novices and highly trained professionals in a field . Yudkowsky (2009) An Intuitive Explanation of Baye's Theorem Where to go from here?
Pointers for a better understanding diagrams “Knowledge Representation for people” Brachman (1985) “Making Bayesian networks more accessible to the probabilistically unsophisticated” Eugene Charniak (1991) Bayesian Networks without Tears. IA Magazine
Towards a new approach 1 - Pointers Central role of human functioning D. Watson, Nobel prize winner (1968) (who discovered the structure of DNA): "drawing and thinking are frequently so simultaneous that the graphic image appears almost an organic extension of the thinking process". • Everyday diagramming • Composed of visual elements which each have some symbolic meaning • Expressing several different types of symbolic information • Contain a number of mixed visual stylesto express these different types respectively • Growing rather than finished • Having parts already drawn being replaced by others • Part of the thinking is inherent in communication • The diagramming process is fluid Need a meta approach
Existing frameworks of understanding diagrams Too fine grained Too broad/general Bertin, Peirce, etc Plastic-robust Weakly-strongly structured Abstract-concrete Different meaning - common structure General-specific Conventionalizedcustomized Abstraction Hidden dependencies Premature commitment Secondary notation Viscosity Visibility Closeness of mapping Consistency Diffuseness Error-proneness Hard mental operations Progressive evaluation Provisionality Role-expressiveness Creative Ambiguity Specificity Detail in context Indexing Synopsie Free rides Useful awkwardness Unevenness Lability Permissiveness Programming Salience Provisionality Story Content Modifiability Controllability Referencability Focus Coordination Documentation Consistency Accountability Traceability Visual immediacy Visual impetus Visual impedance Reductionist Spatial, visual, cognitive, etc.. Eppler et al (2008)
Towards a new approach 2 – Philosophy Dooyeweerd's Meaning-Oriented Approach Dooyeweerd said (1955), "Meaning is the being of all that has been created and the nature even of our selfhood. It has a religious root and a divine origin." This led him to presuppose that Meaning is the primary property of that is, and that Existence emerges from Meaning. Meaning is better grasped intuitively, not theoretically. The ordinary person can understand it in the full, holistic sense of the word
Towards a new approach 3 – Aspectual Philosophy Meaning is given to the cosmos (by its Creator) as a framework. The framework is a framework of law which provides guidance for how all entities function. Diversity of types of existing based on a diversity oftypes of meaning This leads into the notion of Aspects Aspects are irreducible Aspects are related Aspects are not absolute Aspects are independent of things or entities Aspects are rich
Qualifying Aspects of Diagrams Multi Aspectual nature of diagrams
What is a SySpM? A distinct collection of Sy elements, or as A distinct collection of Sp elements, or as A distinct collection of M
Box and Arrow type of diagram Symbolic Aspect Primary Sy 1. Items, entities: meaning deliberate intention of creator to symbolize a distinct concept 2. Relationship: deliberate intention of creator to symbolize the idea that two items are related in a meaningful way Secondary Sy 3. Direction of relationship 4. Relationships can be treated as items 5. Types of items 6. Types of relationship 7. Names to identify the items or relationships
Spatial Aspect Primary Sp 1. Boxes: as being present rather than absent. 2. A line which is straight, curved, or bent. Secondary Sp 3. Boxes shape: this could be a pictogram, a diamond, a square, etc. Box shapes are considered as a spatial sub type of a thing and in this case it is a visual characteristics which may also include color, texture, etc. 4. Box visibility: distinction between 1 and 3 becomes important in software generated diagrams. A box could be present but hidden. Software should be able to understand that an invisible box does not necessarily mean it is not present. 5. Edges of boxes 6. Position of box 7. Size of box 8. Boundary: outside rather than inside. This refers to the spatially defined vicinity of a thing. This is important in cases where a line ends in the vicinity of a box rather than on one of its edges. 9. Route of line. 10. Line texture: this refers to the use of dotted, dashed, thick/narrow features of lines. 11. Connect/Attach: this is about the attachment of a line end to a box in an unambiguous way as opposed to a line being in the vicinity of one box rather than another. 12. Arrow head. These may be of various kinds. They indicate direction of a line. 13. Text. These are used to identify boxes. 14. Empty background (white space): this may actually be decorated as in backdrop. 15. Width of a line.
Putting it all together 1. Sp Mapped to Sy 2. Constraints 3. Sp Not Mapped to Sy Continued
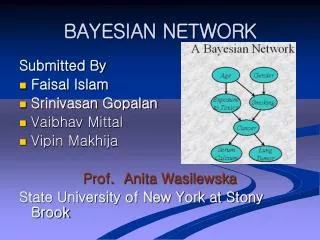
What does this mean for BND’s ? Bayesian networks are complex diagrams A definition of BND: “Bayesian networks are directed acyclic graphs whose: nodes represent variables, and whose edges represent conditional relationships between two variables” 1 2 Consider the use of the Box and Arrows diagram type and modify its constraints to reflect BND Develop BND as a new diagram type. OR
A typical BND Box and Arrows diagram Tabular display