Download

1 / 28
280 likes | 366 Vues
Learn how to record raw data accurately for experiments, including title, labeled columns, observations, and equipment uncertainty. Understand the importance of precision in data recording and how to process raw data to derive meaningful insights.

E N D
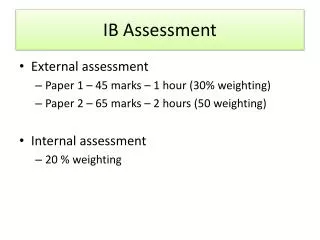
DCP- Aspect 1: Recording raw dataWhat is “raw” data? • Quantitative & Qualitative data that you directly collect during the lab (BEFORE any math is done) • Mass • Volume • Temperature • Observations (qualitative)
What needs to be included in DCP- Aspect 1: Recording raw data? • Title of Data Table • Columns & rows completely labeled • Observations • Level of equipment uncertainty • Level of precision in recorded data remains constant (same number of decimal places)
Title of Data Table; must be… • Numbered • Table 1: ------- • Descriptive: includes both DV & IDV as well as detail • Table 1: Initial & Final Mass of a Dialysis Tube Containing Five Different Concentrations of Sucrose Solution When Immersed for 20 Minutes
Columns & rows completely labeled; must have… • Complete label for column (or row) • Correct Concentration of Sucrose Solution • Incorrect Concentration • Incorrect Concentration of Solution • Incorrect Solution Concentration • Units!! • (M) for Molarity • Always use metric system (no “pounds” or “inches”) • If Data table goes onto a 2nd page, you mustinclude complete column headings again
NOTICE!! The units are ONLY at the top next to the label. Units do NOT go next to the data (#) being recorded.
Page 1 Page 2
Observations; must have… • Detail • If recording data over time (ex: each day for a week), then you will have specific observations every day • Important for your conclusion! (sources of error) • If you state it in conclusion, must be in observations • Description • Be specific as to what you see but do not draw conclusions here
Example 1 Example 2
Equipment uncertainity • IB Bio is different for error than IB Chemistry (yea!) • IB Bio only requires that you look at the equipment you are using when collecting data; list the uncertainty for that equipment only (degree of precision is ± the smallest division on the instrument) • Ex for a scale: if the scale measures to the hundredths place, the equip. uncertainty is +/- 0.01g (can be found on bottom of scale) • 0.05g error for scale + 0.05g error when massing an object = .1g • Do NOT list for anything the teacher provides (example- if I make a solution for you, do not include uncertainty of graduated cylinder) • List that information in 1 place near your raw data table
+/- 0.1g • 0.05g error for scale + 0.05g error when • massing an object = .1g 56 mL +/- 0.5mL +/- 0.01g
Table 1: Height of Wisconsin Fast Plant When Exposed to Blue Wavelengths of Light over 7 Days #’d and descriptive Title Complete column label with units Observations- detailed Uncertainty of ruler measurement: +/- 0.1cm Uncertainty (here or in column heading)
Table 1: Trial #1- Height of Wisconsin Fast Plants When Exposed to Five Different Light Wavelengths over 7 Days NOTE: how to label data when have 2 titles for a column (height & color) NOTE: data is all showing same # of decimal places (“1.0” not “1”) NOTE: observations for all colors each day
Practice scoring this table: • Mini-checklist: • Title of Data Table • Columns & rows completely labeled • Observations • Level of equipment uncertainty • Level of precision
DESIGN- Aspect 2 Processing raw dataWhat is “processed” data? • This is the final data that you will use in order to answer your original research question. • If your question is looking to compare a rate, such as a growth rate: • Raw data: height (cm) for each unit of time(day) • Processed data amount of growth in cm per day (cm/day) • You will use math (or a computer will use math) in order to convert your raw data into processed data. • An average is NOT considered enough to be counted as data processing (even though you will need to average trials before continuing into “processing”)
In order to process your data: • You need to consider what data you have & what you want the data to look like in order to answer your question. • If you are doing the math, you must show 1 example of each type of calculation. • Should come between raw data and your presentation of your processed data (table showing what you calculated) • Also, in order to earn a “complete” for Aspect 2 in DCP, you must use all of your data points while processing.
Which processing is the weakest? • Background Raw data includes height of plant every school day totally 10 data points over 12 days (plant still grows over the weekend) • trying to calculate rate of growth (cm/day) • (final height – initial height) /12 days • Graph raw data & take slope of the line • Calculate rate of growth between each recorded data point & then calculate the average Height of Fast plant (cm) Time (days) Score for Aspect 2 would be a “1”
Examples of scoring: • Background Raw data includes height of plant every school day totally 10 data points over 12 days (plant still grows over the weekend) Took weekends into account; Slope (growth rate)= 0.16cm/day Didn’t take weekends into account; Slope (growth rate)= 0.21cm/day SCORE: 0 major mistake!
Presentation= Table & Graph • When presenting your processed data in a table, it can be a new table or an extra column in an existing table. • Just like all tables, it needs to have a complete title, column headings, degree of precision, etc. • Also need to take into account SIG FIGS • Don’t show your processed data to be more precise than the equipment you used to collect the data • FYI: If your lab dealt with counting living organisms, then IB expects you to round to the nearest whole organism at the end in processing & then present that number. Show BOTH unrounded & rounded! • Sometimes the rounding of living organisms makes it look like there wasn’t a difference (ex: 1.4 #/day vs. 0.6 #/day both round to 1 #/day)
Graphs are also numbered & have the same title as your table • Be sure you have the right type of graph • When labeling bar graphs (Excel calls them “column” graphs), take note of how to label the x-axis: Complete label & unit below; ONLY numbers on x-axis line
ºC should not be part of axis; it should only be underneath next to “temperature” FYI: This person also included equipment uncertainty here, but it isn’t necessary.
Asp 1- Scoring Practice: Why is this a “1/ partial?” Where are the observations?? Should have table #! Temp listed under “maggot #”
Asp 2- Scoring Practice: Why is this a “1?” What if this student had only calculated an average? An average is NOT sufficient math to be considered processing! Therefore, there isn’t any processing. Missing the example/sample calculation!
Asp 3- Scoring Practice: Why is this a “1/ partial?” Units go at the top of the column only! Processed data should ALSO be in a table! Units do not go on x-axis! They go with the label