Download
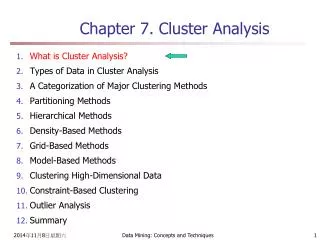
1 / 34
340 likes | 449 Vues
This presentation by J. Devin McAuley from Bowling Green State University explores the concept of entrainment, particularly in relation to circular data. Key topics include examples of entrainment behavior, the unique challenges of circular statistics, and the applications of these statistical methods. The discussion covers calculating mean direction and resultant length, the logic of hypothesis testing, and the limitations of circular statistics, emphasizing their role in understanding rhythmic behaviors and synchronization phenomena.

E N D
Measuring Entrainment:Some Methods and Issues J. Devin McAuley Center for Neuroscience, Mind & Behavior Department of Psychology Bowling Green State University Email: mcauley@bgnet.bgsu.edu Entrainment Network III, Milton Keynes & Cambridge, UK, December 9th – 12th 2005
Outline of Talk • A Few Examples of Entrainment • Entrainment Involves Circular Data • Statistics for Circular Data • What Can I Do With Circular Statistics? • What Can’t I Do?
Produced Interval (P) A Simple Example Target T ... (A) Stimulus Sequence (B) Tapping Sequence
Entrainment Involves Circular Data • A simple way to describe any rhythmic behavior is using a circle. • Each point on the circle represents a position in relative time (a phase angle). • The start point is arbitrary.
Polar versus Rectangular Coordinates 90 (x, y) r 0, 360 180 270
(0, 1) 90 (x, y) R = 1 180 0 (-1, 0) (1,0) x = cos 270 y = sin (1, 0)
Produced Interval (P) A Simple Example Target T ... (A) Stimulus Sequence (B) Tapping Sequence
A Tale of Two Oscillators Driven Oscillator Driving Oscillator r r
Case 1: Perfect Synchrony Driven Oscillator Driving Oscillator = 0 = 0 Each Produced Tap
Case 2: Taps Lag Tones Driven Oscillator Driving Oscillator = 45 = 0 Each Produced Tap
Case 3: Taps Ahead of Tones Driven Oscillator Driving Oscillator = 0 = 315 Each Produced Tap
Case 4: Entrainment Driven Oscillator Driving Oscillator = 0 → , as n ↑ Each Produced Tap
Why won’t linear statistics work? • With circular data there is a cross-over problem. • For example, measured in degrees, the linear mean of 359 and 1 is 180, not 0 • This problem arises no matter what the start point is, and is independent of unit of measurement.
Statistics for Circular Data • Descriptive Statistics • Mean Direction, • Mean Resultant Length, R • Circular Variance, V • Inferential Statistical Tests
90 180 0 270
(0, 1) 90 (x, y) R = 1 180 0 (-1, 0) (1,0) x = cos 270 y = sin (1, 0)
Calculating a Mean (x1, y1) (x2, y2)
Calculating a Mean (X, Y) X = x1 + x2 Y = y1 + y2
(Pythagorean Theorem) Mean Resultant Length, R
Circular Variance, V V = 1 – R
90 180 0 270
= 50 R = 0.34 90 180 0 270
90 180 0 270
= 344 R = 0.88 90 180 0 270
Statistics for Circular Data • Descriptive Statistics • Mean Direction, • Mean Resultant Length, R • Circular Variance, V • Inferential Statistical Tests
Logic of Hypothesis Testing • State Null & Alternative Hypotheses • Determine Critical Value • for pre-selected alpha level (e.g., = 0.05) • Calculate Test Statistic • If Test Statistic > Critical Value • then Reject Null (e.g., p < 0.05) • otherwise Retain Null
Inferential Statistics • Test for uniformity • Test for unspecified mean direction • Test for specified mean direction
Logic of Hypothesis Testing • State Null & Alternative Hypotheses • Determine Critical Value • for pre-selected alpha level (e.g., = 0.05) • Calculate Test Statistic • If Test Statistic > Critical Value • then Reject Null (e.g., p < 0.05) • otherwise Retain Null
What can I do with circular stats?(not an exhaustive list) • Descriptive statistics • Mean direction and length • Variance, Standard Deviation • Skewness, Kurtosis • Inferential statistics • Uniformity, symmetry • Unspecified and specified mean direction • Comparison of two or more samples • Confidence intervals
What can’t I do with circular stats? • Circular statistics do not address sequential dependencies.