Download

1 / 11
110 likes | 221 Vues
Discover feedback from participants on Missouri Reading Initiative's impact on teaching practices, student performance, and program effectiveness. Explore trends and improvements over the years.

E N D
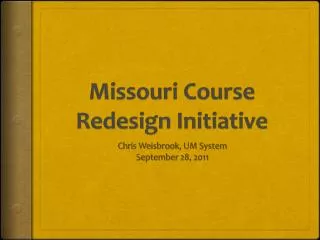
The Missouri Reading Initiative Spring 2008 Annual Participant Survey Results
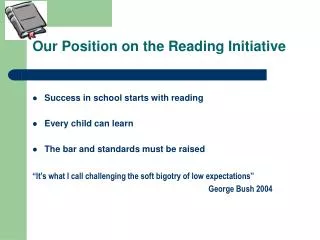
Participant Survey • The annual MRI Participant Survey gathers information about respondents’ perceptions of the value of the content, process, and outcomes of the Missouri Reading Initiative, ratings of the overall program, reported changes/reinforcement of practice, views of student performance, etc. • Because this was the seventh annual implementation of this survey, it allows for year to year comparisons both about and between cohorts. • Beginning in 2005, MRI collected participants’ responses in grades 4 and above.In 2007 surveying began for Secondary Level Schools.
Participant Survey The following slides focus on two questions: We have found that ratings generally go up from year to year as participants become more familiar with the program and, more importantly, begin to see the tangible results of improved student reading in their classrooms. (Follow arrows for examples)
“Change” by MRI Year: 2002-2004How has the MISSOURI READING INITIATIVE changed or reinforced your teaching?On a Scale of 1 (“Not at All”) to 5 (“A Great Deal”) This table shows the annual average response to the “Change” question between 2002-2004 when MRI was a K-3 program only.
“Change” by MRI Year: 2002-2004How has the MISSOURI READING INITIATIVE changed or reinforced your teaching?On a Scale of 1 (“Not at All”) to 5 (“A Great Deal”) In 2004-2005 MRI expanded to grades 4-6. At first the average “Change” responses were lower for the 4-6 group, but as MRI staff responded to concerns expressed by participants the scores rose to K-3 levels.
“Rate” by MRI Year: 2002-2004Reflecting on the effectiveness of the MRI program as a whole,how would you rate it? On a scale of 1 (Poor) to 5 (Excellent) This table shows the annual average response to the “Rate” question between 2002-2004 when MRI was a K-3 program only.
“RATE” by MRI Year: 2005-2008Reflecting on the effectiveness of the MRI program as a whole, how would you rate it? On a scale of 1 (Poor) to 5 (Excellent) In 2004-2005 MRI expanded to grades4-6. At first the average “Rate” responses were lower for the 4-6 group, but as MRI staff responded to concerns expressed by participants the scores rose to K-3 levels. This year, however, 1st year scores at all levels were depressed by an “outlier” district where four participating schools had unusually low scores. MRI staff will use this information to address whatever implementation issues there are and, as a consequence, we would expect to see the scores rebound in 2008-2009.
Secondary Program: In 2006 MRI developed a professional development program for grades 7-12. An essential feature of this program was the differentiation of strategies based on whether a classroom teacher’s specialization was communication arts or a content area like social studies, math, etc. In 2007 MRI began to survey participants to help get a measure of their reactions to the program and what knowledge and skills they were receiving. Generally speaking, as we learned when MRI expanded to grades 4-6 two years earlier, content area teachers respond better to the training, and derive more from it, when the training is tailored to their needs; e.g., literacy strategies need to be embedded in their content teaching, assessments need to be efficient, etc.
Secondary Program: The following table compares responses to both the “Change” and “Rate” questions for 2007 and 2008. Upper middle school and secondary teachers, regardless of “type”; i.e., communications arts (CA) or content (CON), scored the program higher in 2008 than in 2007. As the program matures, and MRI identifies the training approaches that best serve the participants needs, this trend should continue to improve
Participant Survey:Trainer Ratings MRI Participants are asked to respond to a series of questions about various qualities of the trainers relevant to successful program implementation. The scores are on a scale of 1=“Poor” to 5=“Excellent” .
Trainer Summaries: 2008 Survey The data presented in this table shows that, in general, respondents give trainers very favorable scores in all categories