Exponential Growth
Exponential Growth. Section 8.1. Exponential Function. f(x) = ab x where the base b is a positive number other than one. Graph f(x) = 2 x Note the end behavior x →+∞ f(x) →+∞ x→-∞ f(x)→0 y=0 is an asymptote. Asymptote.

Exponential Growth
E N D
Presentation Transcript
Exponential Growth Section 8.1
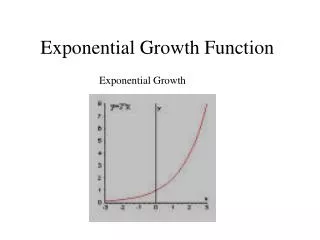
Exponential Function • f(x) = abxwhere the base b is a positive number other than one. • Graph f(x) = 2x • Note the end behavior • x→+∞ f(x)→+∞ • x→-∞ f(x)→0 • y=0 is an asymptote
Asymptote • A line that a graph approaches as you move away from the origin The graph gets closer and closer to the line y = 0 ……. But NEVER reaches it
f(x) = 2x • Passes thru the point (0,a) (the y intercept is a) • The x-axis is the asymptote of the graph • D is all reals (the Domain) • R is y>0 if a>0 and y<0 if a<0 (the range) These are true of: • y = abx • If a>0 & b>1 ……… • The function is an Exponential Growth Function
Ex • Graph y = ½ 3x • Plot (0, ½) and (1, 3/2) • Then, from left to right, draw a curve that begins just above the x-axis, passes thru the 2 points, and moves up to the right
D= all reals R= all reals>0 Y = 0 asymptote
To graph a general Exponential Function: • y = a bx-h + k • Sketch y = a bx • h= ??? k= ??? • Move your 2 points h units left or right …and k units up or down • Then sketch the graph with the 2 new points.
Example 3 Graph y = 3·2x-1-4 • Lightly sketch y=3·2x • Passes thru (0,3) & (1,6) • h=1, k=-4 • Move your 2 points to the right 1 and down 4 • AND your asymptote k units (4 units down in this case)
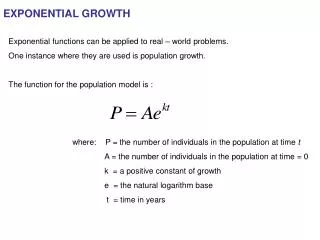
You can model growth or decrease with the following formula: decay by a constant percent increase In the formula, the base of the exponential expression , 1 + r,is called the growth factor. Similarly, 1 – ris the decay factor.
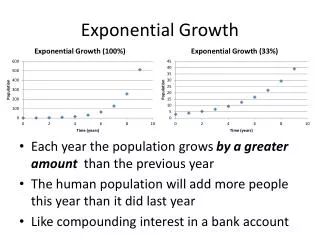
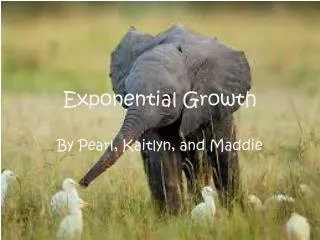
Example • In 1981, the Australian humpback whale population was 350 and increased at a rate of 14% each year since then. Write a function to model population growth. Use a graph to predict when the population will reach 20,000 • Exponential growth function P(t) = a(1 + r)t P(t) = 350(1 + 0.14)t Substitute 350 for a and 0.14 for r. Simplify. P(t) = 350(1.14)t
It will take about 31 years for the population to reach 20,000.
A motor scooter purchased for $1000 depreciates at an annual rate of 15%. Write an exponential function and graph the function. Use the graph to predict when the value will fall below $100.
Compound Interest • A=P(1+r/n)nt • P - Initial principal • r – annual rate expressed as a decimal • n – compounded n times a year • t – number of years • A – amount in account after t years
Compound interest example • You deposit $1000 in an account that pays 8% annual interest. • Find the balance after I year if the interest is compounded with the given frequency. • a) annually b) quarterly c) daily A=1000(1+.08/365)365x1 ≈1000(1.000219)365 ≈ $1083.28 A=1000(1+ .08/1)1x1 = 1000(1.08)1 ≈ $1080 A=1000(1+.08/4)4x1 =1000(1.02)4 ≈ $1082.43